The length of 40 leaves of a plant are measured correct to one millimetre,

Question.
The length of 40 leaves of a plant are measured correct to one millimetre, and the obtained data is represented in the following table:
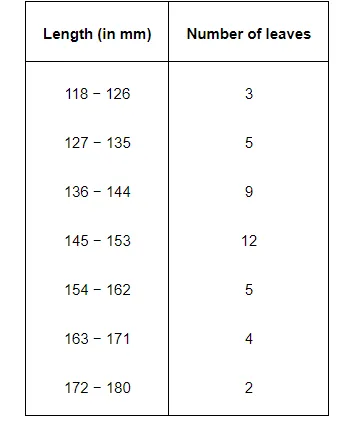
(i) Draw a histogram to represent the given data.
(ii) Is there any other suitable graphical representation for the same data?
(iii) Is it correct to conclude that the maximum number of leaves are 153 mm long? Why?
The length of 40 leaves of a plant are measured correct to one millimetre, and the obtained data is represented in the following table:
(i) Draw a histogram to represent the given data.
(ii) Is there any other suitable graphical representation for the same data?
(iii) Is it correct to conclude that the maximum number of leaves are 153 mm long? Why?
Solution:
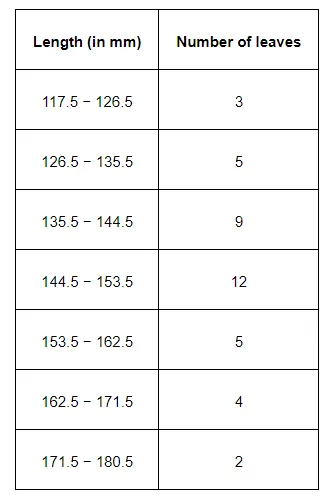
(i) It can be observed that the length of leaves is represented in a discontinuous class interval having a difference of 1 in between them. Therefore, $\frac{1}{2}=0.5$ has to be added to each upper class limit and also have to subtract $0.5$ from the lower class limits so as to make the class intervals continuous.
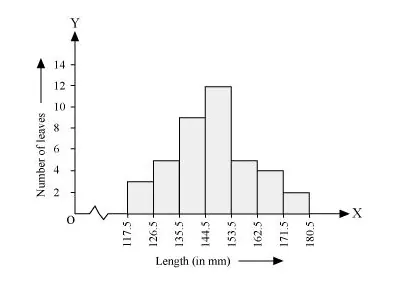
Taking the length of leaves on x-axis and the number of leaves on y-axis, the histogram of this information can be drawn as above.
Here, 1 unit on y-axis represents 2 leaves.
(ii) Other suitable graphical representation of this data is frequency polygon.
(iii) No, as maximum number of leaves (i.e., 12) has their length in between 144.5 mm and 153.5 mm. It is not necessary that all have their lengths as 153 mm.
(i) It can be observed that the length of leaves is represented in a discontinuous class interval having a difference of 1 in between them. Therefore, $\frac{1}{2}=0.5$ has to be added to each upper class limit and also have to subtract $0.5$ from the lower class limits so as to make the class intervals continuous.
Taking the length of leaves on x-axis and the number of leaves on y-axis, the histogram of this information can be drawn as above.
Here, 1 unit on y-axis represents 2 leaves.
(ii) Other suitable graphical representation of this data is frequency polygon.
(iii) No, as maximum number of leaves (i.e., 12) has their length in between 144.5 mm and 153.5 mm. It is not necessary that all have their lengths as 153 mm.