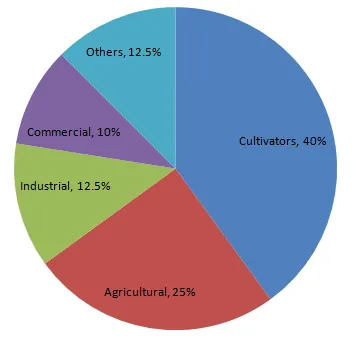
The percentages of various categories of workers in a state are given in the following table.
| Categoies | Culti-vators | Agricultural Labourers | Industrial Workers | Commercial Workers | Others |
| % of workers | 40 | 25 | 12.5 | 10 | 12.5 |
Present the information in the form a pie-chart.
We know:
Central angle of a component = (component value/sum of component values
Here, total percentage of workers = 100
Thus, the central angle for each component can be calculated as follows:
| Category | Percentage of workers | Sector angle |
| Cultivators | 40 | 40/100 |
| Agricultural labourers | 25 | 25/100 |
| Industrial workers | 12.5 | 12.5/100 |
| Commercial workers | 10 | 10/100 |
| Others | 12.5 | 12.5/100 |
Now, the pie chat representing the given data can be constructed by following the steps below:
Step 1 : Draw circle of an appropriate radius.
Step 2 : Draw a vertical radius of the circle drawn in step 1.
Step 3 : Choose the largest central angle. Here, the largest central angle is 144o. Draw a sector with the central angle 144o in such a way that one of its radii coincides with the radius drawn in step 2 and another radius is in its counter clockwise direction.
Step 4 : Construct other sectors representing other items in the clockwise direction in descending order of magnitudes of their central angles.
Step 5 : Shade the sectors with different colours and label them, as shown as in figure below.