The production of saleable steel in some of the steel plants of our country during 1999 is given below:

The production of saleable steel in some of the steel plants of our country during 1999 is given below:
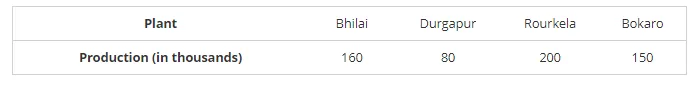
Construct a bar graph to represent the above data on a graph paper by using the scale 1 big divisions = 20 thousand tonnes.
To represent the given data by a vertical bar graph, we first draw horizontal and vertical axes. Let us consider that the horizontal and vertical axes represent the plants and the production in thousand tonnes respectively. We have to draw 4 bars of different lengths given in the table.
The scale 1 big divisions must be 20 thousand tonnes. So, fast find the heights of the bars corresponding to different plants. After that, we follow the well known procedure.
The heights of the different bars are:
The height of the bar corresponding to Bhilai 160/20 = 8 big division.
The height of the bar corresponding to Durgapur is 80/20 = 4 big divisions.
The height of the bar corresponding to Rourkela =10 big divisions.
The height of the bar corresponding to Bokaro is = 7.5 big divisions.
At first we mark 4 points in the horizontal axis at equal distances and erect rectangles of the same width at these points. The heights of the rectangles are proportional to the productions. The vertical bar graph of the given data is following:
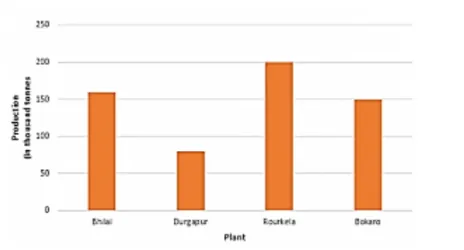
Note that one big division in the vertical axis is equivalent to 20 thousand tonnes