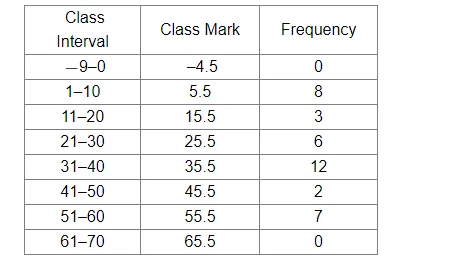
Draw a frequency polygon for the following frequency distribution.

Draw a frequency polygon for the following frequency distribution.

Though the given frequency table is in inclusive form, class marks in case of inclusive and exclusive forms are the same.
We take the imagined classes (
Thus, we have:
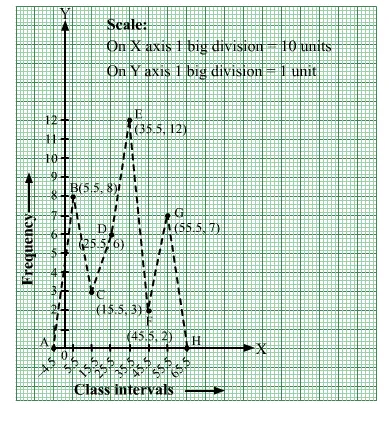
Along the x-axis, we mark –4.5, 5.5, 15.5, 25.5, 35.5, 45.5, 55.5 and 65.5.
Along the y-axis, we mark 0, 8, 3, 6, 12, 2, 7 and 0.
We have chosen the scale as follows :
On the x-axis, 1 big division = 10 units.
On the y-axis, 1 big division = 1 unit.
We plot the points A(–4.5,0), B(5.5, 8), C(15.5, 3), D(25.5, 6), E(35.5, 12), F(45.5, 2), G(55.5, 7) and H(65.5, 0).
We draw line segments AB, BC, CD, DE, EF, FG, GH to obtain the required frequency polygon, as shown below.