Draw the graph of the equation y = 3x.

Question:
Draw the graph of the equation y = 3x.
From your graph, find the value of y when
(i) x = 2
(ii) x = –2.
Solution:
Given equation: y = 3x
When x = -2, y = -6.
When x = -1, y = -3.
Thus, we have the following table:
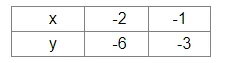
Now plot the points (-2,-6), (-1, -3) on a graph paper.
Join the points and extend the line in both the directions.
The line segment is the required graph of the equation.
From the graph we can see that when x = 2, y = 6

Also, when x = -2, y = -6.