For a simple pendulum, a graph is plotted between its kinetic energy

Question:
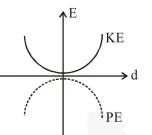
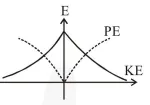
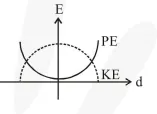
For a simple pendulum, a graph is plotted between its kinetic energy (KE) and potential energy (PE) against its displacement $\mathrm{d}$. Which one of the following represents these correctly? (graphs are schematic and not drawn to scale)
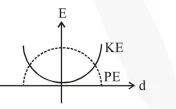
Correct Option: , 4
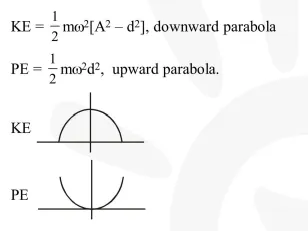
Solution: