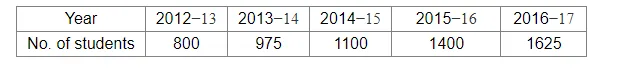
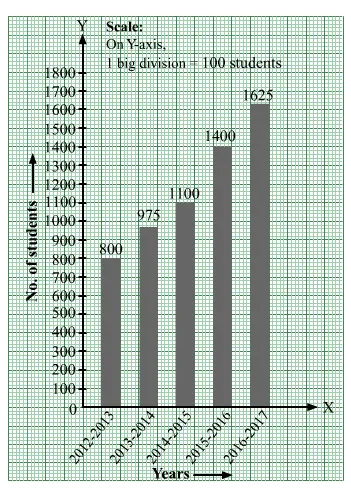
Given below is a table which shows the yearwise strength of a school. Represent this data by a bar graph.
Leave a comment
All Study Material