Prove the following

Question:
Solution:
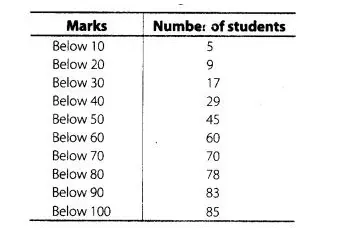
Here, we observe that, 5 students have scored marks below 10, i.e. it lies between class interval 0-10 and 9 students have scored marks below 20,
So, (9 – 5) = 4 students lies in the class interval 10-20. Continuing in the same manner, we get the complete frequency distribution table for given
data.
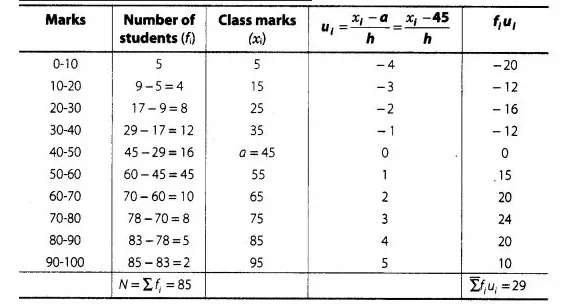
Here, (assumed mean) $a=45$
and (class width) $h=10$
By step deviation method,
$\operatorname{Mean}(\bar{x})=a+\frac{\Sigma f_{i} u_{i}}{\Sigma f_{i}} \times h=45+\frac{29}{85} \times 10=45+\frac{58}{17}$
$=45+3.41=48.41$