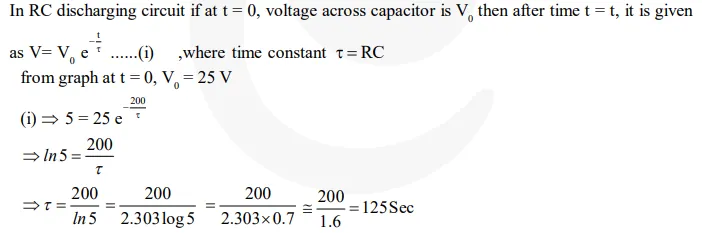
The figure shows an experimental plot for discharging of a capacitor in an R–C circuit.

Question:
The figure shows an experimental plot for discharging of a capacitor in an $\mathrm{R}-\mathrm{C}$ circuit. The time constant $\tau$ of this circuit lies between:-
Correct Option: 1
Solution: