
Question:
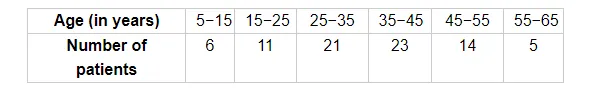
The following table show the ages of the patients admitted in a hospital during a year:
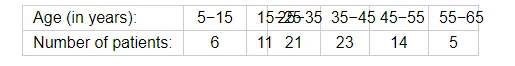
Find the mode and the mean of the data given above. Compare and interpret the two measures of central tendency.
Solution:
Here, the maximum frequency is 23 so the modal class is 35−45.
Therefore,
$l=35$
$h=10$
$f=23$
$f_{1}=21$
$f_{2}=14$
$\Rightarrow$ Mode $=l+\frac{f-f_{1}}{2 f-f_{1}-f_{2}} \times h$
$=35+\frac{2}{46-35} \times 10$
$=35+\frac{2}{11} \times 10$
$=35+\frac{20}{11}$
$=35+1.80$
Mode $=36.8$ years
Thus, the mode of the ages of the patients is 36.8 years.
Calculation for mean.
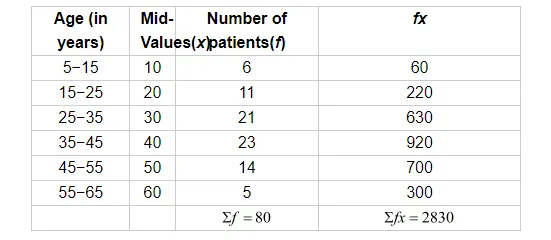
Mean $=\frac{\sum f x}{\sum f}=\frac{2830}{80}=35.37$
Thus, the mean age of the patients is 35.37 years.
The mean age of the patients is less than the modal age of the patients.