The given plots represent the variation of the concentration

Question:
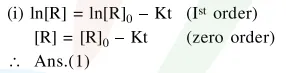
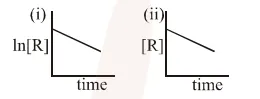
The given plots represent the variation of the concentration of a reactant $\mathrm{R}$ with time for two different reactions (i) and (ii). The respective orders of the reactions are :
Correct Option: 1
Solution: