The given plots represents the variation of the concentration

Question:
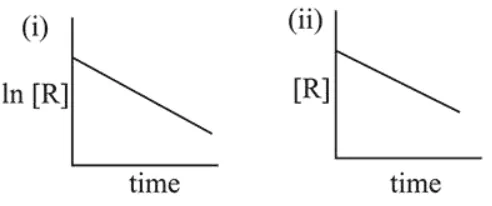
The given plots represents the variation of the concentration of a reactant $R$ with time for two different reactions (i) and (ii). The respective orders of the reactions are:
Correct Option: 1
Solution:
In graph (i), In [Reactant vs time is linear with positive intercept and negative slope. Hence it is $1^{\text {st }}$ order In graph (ii), [Reactant] vs time is linear with positive intercept and negative slope. Hence, it is zero order.