
Question.
The runs scored by two teams A and B on the first 60 balls in a cricket match are given below:
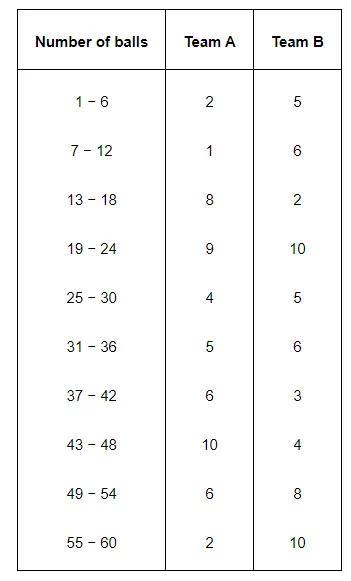
Represent the data of both the teams on the same graph by frequency polygons.
The runs scored by two teams A and B on the first 60 balls in a cricket match are given below:
Represent the data of both the teams on the same graph by frequency polygons.
Solution:
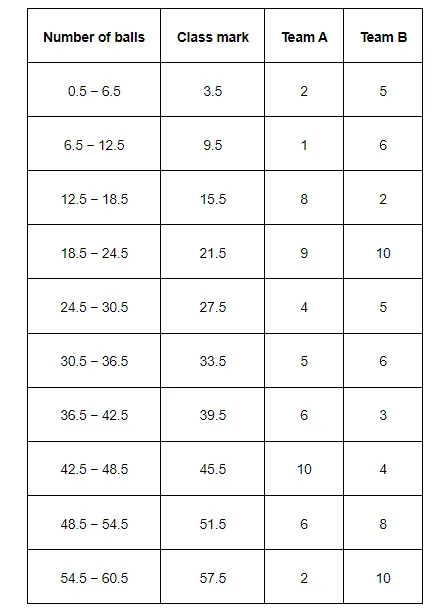
It can be observed that the class intervals of the given data are not continuous. There is a gap of 1 in between them. Therefore, $\frac{1}{2}=0.5$ has to be added to the upper class limits and $0.5$ has to be subtracted from the lower class limits.
Also, class mark of each interval can be found by using the following formula.
Class mark $=\frac{\text { Upper class limit }+\text { Lower class limit }}{2}$
Continuous data with class mark of each class interval can be represented as follows.
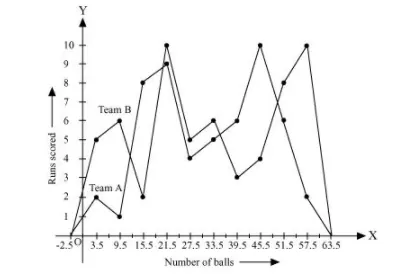
By taking class marks on x-axis and runs scored on y-axis, a frequency polygon can be constructed as follows.
It can be observed that the class intervals of the given data are not continuous. There is a gap of 1 in between them. Therefore, $\frac{1}{2}=0.5$ has to be added to the upper class limits and $0.5$ has to be subtracted from the lower class limits.
Also, class mark of each interval can be found by using the following formula.
Class mark $=\frac{\text { Upper class limit }+\text { Lower class limit }}{2}$
Continuous data with class mark of each class interval can be represented as follows.
By taking class marks on x-axis and runs scored on y-axis, a frequency polygon can be constructed as follows.