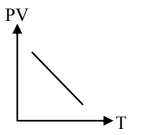
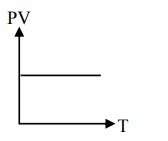
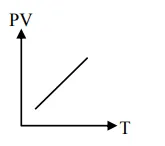
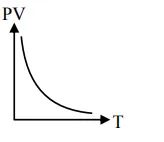
Which of the following graphs represent the behavior of an ideal gas ? Symbols have their usual meaning.
Correct Option: , 3
$\mathrm{PV}=\mathrm{nRT}$
$P V \propto T$
Straight line with positive slope $(\mathrm{nR})$
Leave a comment
All Study Material