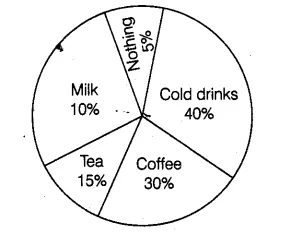
A survey was carried out to

Question:
A survey was carried out to find the favourite beverage preferred by a certain group of young people. The following pie chart shows the findings of this survey.
From this pie chart, answer the following:
(i) Which type of beverage is liked by the maximum number of people?
(ii) If 45 people like tea, how many people were surveyed?
Solution:
(i) The percentage of people preferring cold drinks is maximum. So, cold drinks is liked by the maximum number of people.
(ii) From the pie chart, number of people who like tea $=45$
$\Rightarrow \quad 15 \%$ of total number of people surveyed $=45$
$\Rightarrow \quad \frac{15}{100} \times$ Total number of people surveyed $=45$
$\therefore$ Total number of people surveyed $=\frac{45 \times 100}{15}=300$