
Question:
Draw a curve showing density or pressure variations with respect to distance for a disturbance produced by sound. Mark the position of compression and rarefaction on this curve. Also define wavelengths and time period using this curve. (CBSE 2012)
Solution:
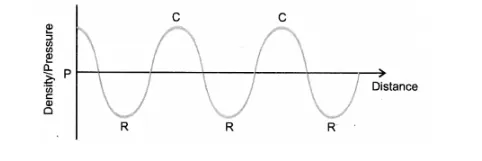
Wavelength : Distance between two successive compressions or two successive rarefactions.
Time Period: Time taken by the disturabnce to travel between two successive compressions or between two successive rarefaction.