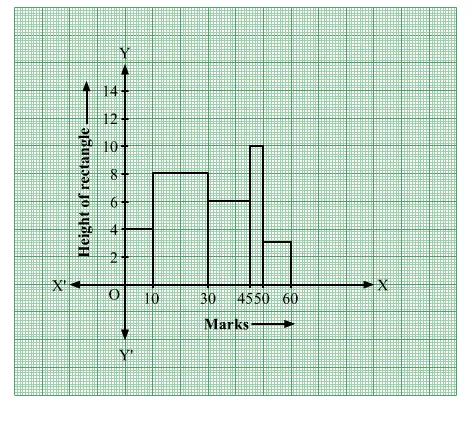
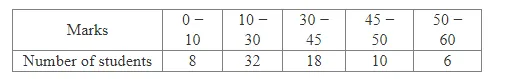
Draw a histogram to represent the following information:

Question:
Draw a histogram to represent the following information:
Solution:
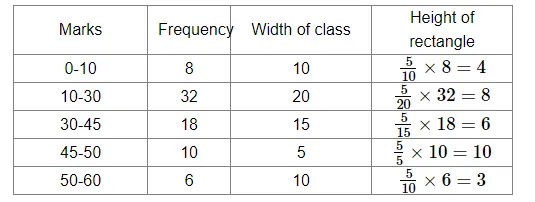
Here the class intervals are of unequal size. So, we calculate the adjusted frequency using the formula,
Adjusted freq $=\frac{\min \text { class size }}{\text { class size of this class }} \times$ freq
Minimum class size = 5