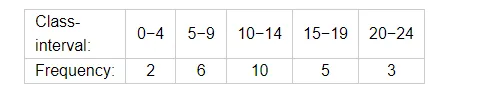
Draw an ogive to represent the following frequency distribution:

Question:
Draw an ogive to represent the following frequency distribution:
Solution:
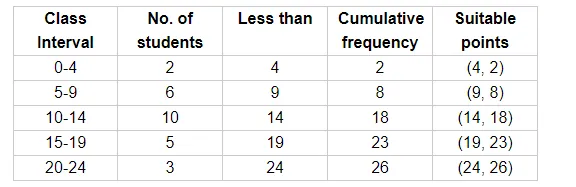
Firstly, prepare the cumulative frequency table.
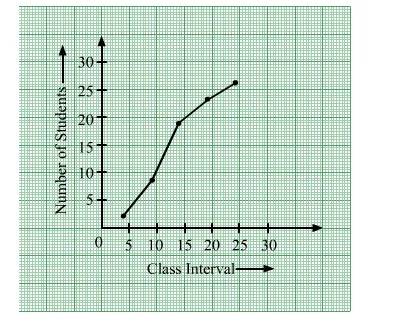
Now, plot the less than ogive using the suitable points.