Question:
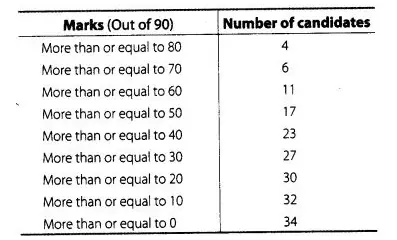
From the frequency distribution table from the following data.
Solution:
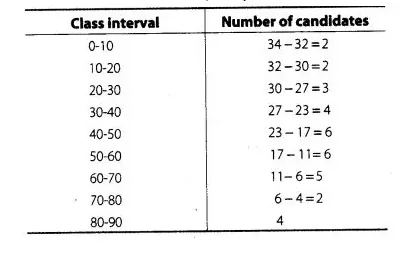
Here, we observe that, all 34 students have scored marks more than or equal to 0. Since, 32 students have scored marks more than or equal to 10.
So, 34- 32 =2 students lies in the interval 0-10 and so on.
Now, we construct the frequency distribution table.