Given below are the seats won by different political parties in the polling outcome of a state assembly elections:
Question.
Given below are the seats won by different political parties in the polling outcome of a state assembly elections:

(i) Draw a bar graph to represent the polling results.
(ii) Which political party won the maximum number of seats?
Given below are the seats won by different political parties in the polling outcome of a state assembly elections:

(i) Draw a bar graph to represent the polling results.
(ii) Which political party won the maximum number of seats?
Solution:
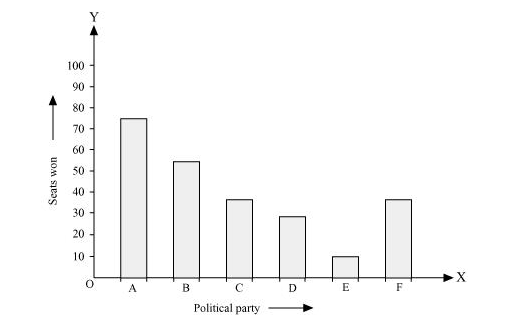
(i) By taking polling results on x-axis and seats won as y-axis and choosing an appropriate scale (1 unit = 10 seats for y-axis), the required graph of the above information can be constructed as follows.

Here, the rectangle bars are of the same length and have equal spacing in between them.
(ii) Political party ‘A’ won maximum number of seats.
(i) By taking polling results on x-axis and seats won as y-axis and choosing an appropriate scale (1 unit = 10 seats for y-axis), the required graph of the above information can be constructed as follows.

Here, the rectangle bars are of the same length and have equal spacing in between them.
(ii) Political party ‘A’ won maximum number of seats.
Click here to get exam-ready with eSaral
For making your preparation journey smoother of JEE, NEET and Class 8 to 10, grab our app now.
