In a hypothetical sample of 20 people,

Question:
In a hypothetical sample of 20 people, the amount of money (in t thousands) with each was found to be as follows:
114, 108, 100, 98, 101, 109, 117, 119, 126, 131,
136, 143, 156, 169, 182, 195, 207, 219, 235, 118
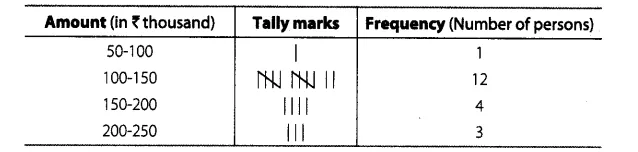
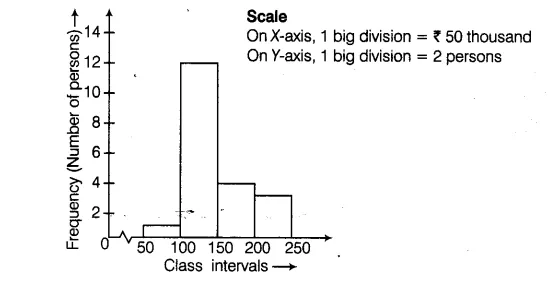
Draw a histogram of the frequency distribution, taking one of the class intervals as 50-100.
Solution:
Before preparing histogram of the given data, we will prepare the frequency distribution table.