
Question:
In a hypothetical sample of 20 people the amounts of money with them were found to be as follows:
114, 108, 100, 98, 101, 109, 117, 119, 126, 131, 136, 143, 156, 169, 182, 195, 207, 219, 235, 118.
Draw the histogram of the frequency distribution (taking one of the class intervals as 50−100).
Solution:
We first prepare the frequency table for the class intervals $50-100,100-150, \ldots, 200-250$, as shown below:
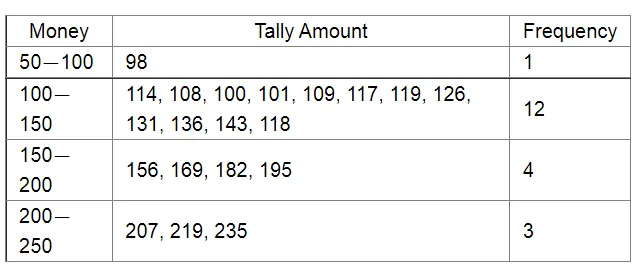
The class limits are represented along the x-axis and the frequencies along the y-axis on a suitable scale. Taking the class intervals as bases and the corresponding frequencies as heights, the rectangles can be drawn to obtain the histogram of the given frequency distribution. The histogram is shown below:.webp)