In a study of diabetic patients in a village, the following observations were noted.

Question:
In a study of diabetic patients in a village, the following observations were noted.

Represent the above data by a frequency polygon.
Solution:
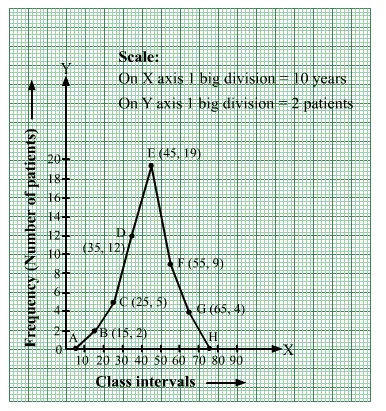
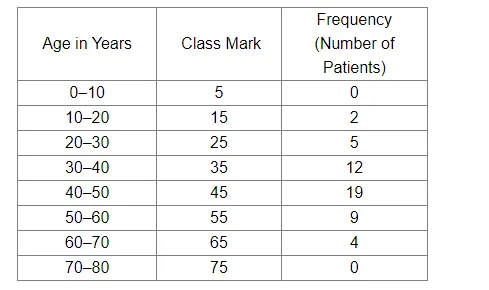
We take two imagined classes—one at the beginning (0–10) and other at the end (70–80)—each with frequency zero.
With these two classes, we have the following frequency table:
Now, we plot the following points on a graph paper:
A(5, 0), B(15, 2), C(25, 5), D(35, 12), E(45, 19), F(55, 9), G(65, 4) and H(75, 0)
Join these points with line segments AB, BC, CD, DE, EF, FG, GH ,HI and IJ to obtain the required frequency polygon.