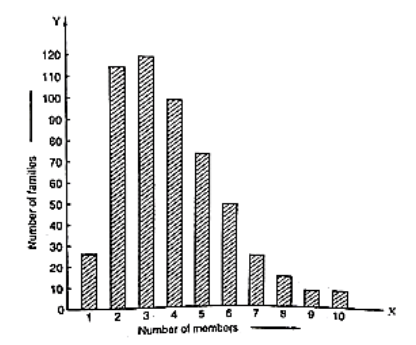
Read the bar graph given in and answer the following questions:

(i) What information is given by the bar graph?
(ii) What was the crop-production of rice in 1970 – 71?
(iii) What is the difference between the maximum and minimum production of rice?
(i) The bar graph represents the production of the rice crop in India in different years.
(ii) According to the height of the 3rd bar from the left, the crop-production of rice in 1970 – 71 is 42.5 lakh tonnes.
(iii) The maximum product of rice is 55 lath tonnes (height of the 4th bar from the left) in the year 1980 – 81 and the minimum product of rice is 22 lath tonnes (height of the 1st bar from the left) in the year 1950 – 51. Hence, the difference between maximum and minimum production of rice (in lath tonnes) is 55 – 22 = 33
Click here to get exam-ready with eSaral
For making your preparation journey smoother of JEE, NEET and Class 8 to 10, grab our app now.
