
Question:
Read the bar graph given in figure and answer the following questions:
(i) What information does it give?
(ii) In which part the expenditure on education is maximum in 1980?
(iii) In which part the expenditure has gone up from 1980 to 1990?
(iv) In which part the gap between 1980 and 1990 is maximum?
Solution:
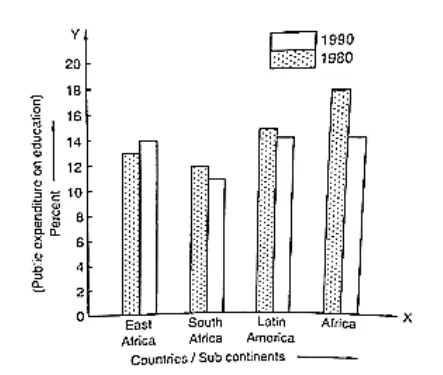
(i) The bar graph represents the public expenditure on education in different countries and sub continents in the years 1980 and 1990.
(ii) The expenditure on education in Africa in 1980 is the maximum.
(iii) It is clear from the bar graph that in East Africa the expenditure has gone up from 1980 to 1990.
(iv) It is observed from the bar graph that the gap between expenditures in 1980 and 1990 is maximum in Africa, which is 18 -14 = 4 %