Read the following bar graph and answer the following questions:

Question:
Read the following bar graph and answer the following questions:
(i) What is the information given by the bar graph?
(ii) State each of the following whether true or false.
(a) The number of government companies in 1957 is that of 1982 is 1:9.
(b) The number of government companies has decreased over the year 1957 to 1983.
Solution:
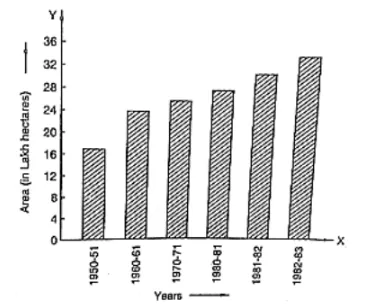
(i) The bar graph represents the number of government companies in India during some years.
(ii) (a) The number of companies in 1957 was 50 and the number of companies in 1982 was 375. Their ratio in that order is 50: 375 = 2: 15
Hence, the statement is false.
(b) The height of the bar graphs increases over the years 1957 to 1983. Hence, the statement is false.
2:15