Read the following bar graph and answer the following questions:

Question:
Read the following bar graph and answer the following questions:
(i) What information is given by the bar graph?
(ii) What was the production of cement in the year 1980 – 81?
(iii) What are the minimum and maximum production of cement and corresponding years?
Solution:
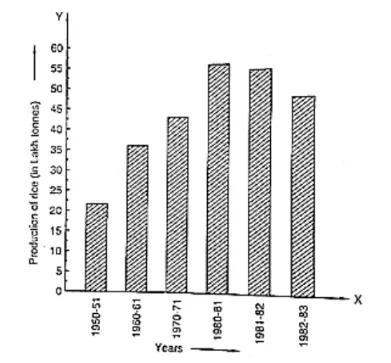
(i) The bar graph represents the industrial production of cement in different years in India.
(ii) According to the height of the 6th bar from the left. the production of cement in the year 1980 – 81 was 186 lakh tonnes.
(iii) According to the heights of the bars. The minimum production of cement is 30 lakh tonnes in the year 1950 – 51 and the maximum production of cement is 232 lakh tonnes in the year 1982 – 83.