The figure is the plot of stopping potential versus the frequency of

Question:
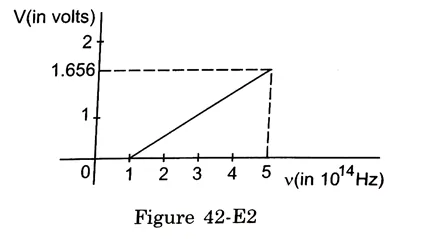
The figure is the plot of stopping potential versus the frequency of the light used in an experiment on photoelectric effect. Find
(a) The ratio $h / e$ and
(b) The work function.
Figure 42-E2
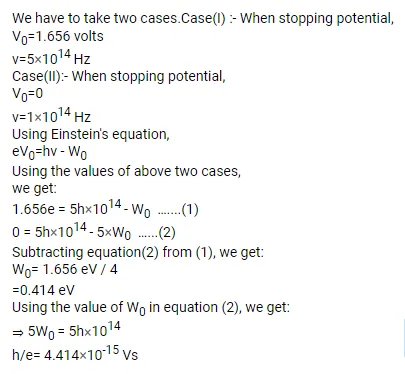
Solution: