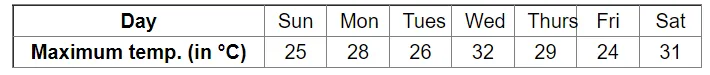
The following table depicts the maximum temperature on the seven days of a particular week. Study the table and draw a line graph for the same.
Leave a comment
All Study Material
.webp)
