The following table gives the distribution of students of two sections according to the mark obtained by them:

Question.
The following table gives the distribution of students of two sections according to the mark obtained by them:
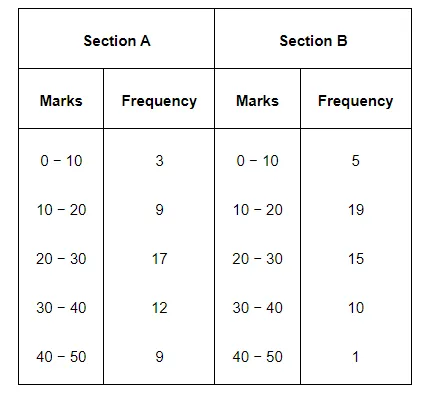
Represent the marks of the students of both the sections on the same graph by two frequency polygons. From the two polygons compare the performance of the two sections.
The following table gives the distribution of students of two sections according to the mark obtained by them:
Represent the marks of the students of both the sections on the same graph by two frequency polygons. From the two polygons compare the performance of the two sections.
Solution:
We can find the class marks of the given class intervals by using the following formula.
Class mark $=\frac{\text { Upper class limit }+\text { Lower class limit }}{2}$
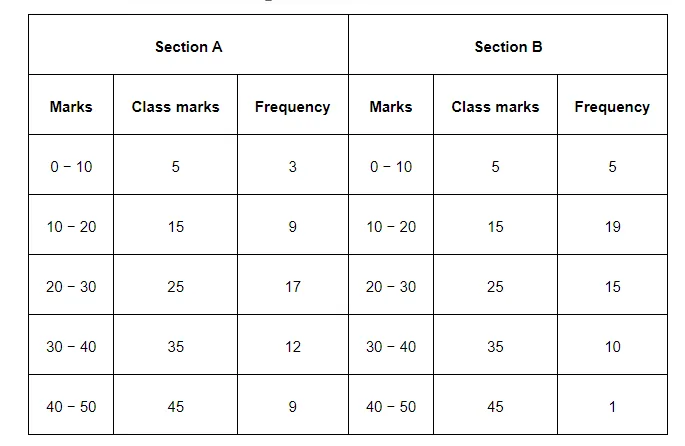
Taking class marks on x-axis and frequency on y-axis and choosing an appropriate scale (1 unit = 3 for y-axis), the frequency polygon can be drawn as follows.
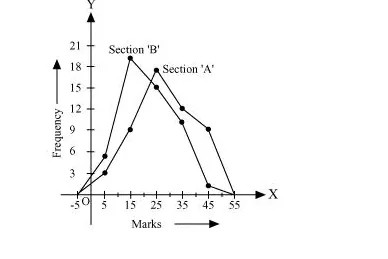
It can be observed that the performance of students of section ‘A’ is better than the students of section ‘B’ in terms of good marks.
We can find the class marks of the given class intervals by using the following formula.
Class mark $=\frac{\text { Upper class limit }+\text { Lower class limit }}{2}$
Taking class marks on x-axis and frequency on y-axis and choosing an appropriate scale (1 unit = 3 for y-axis), the frequency polygon can be drawn as follows.
It can be observed that the performance of students of section ‘A’ is better than the students of section ‘B’ in terms of good marks.