The following table shows the cumulative frequency

Question:
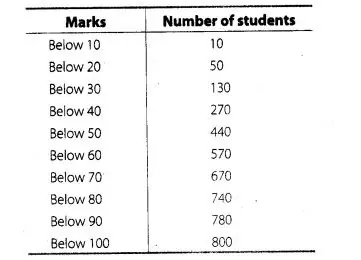
The following table shows the cumulative frequency distribution of marks of 800 students in an examination.
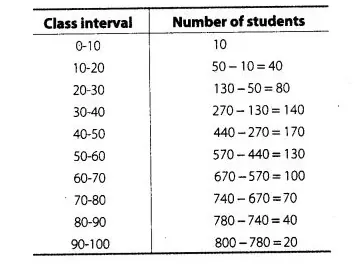
Construct a frequency distribution table for the data above.
Solution:
Here, we observe that 10 students have scored marks below 10 i.e., it lies between class interval 0-10. Similarly, 50 students have scored marks below 20. So, 50 -10 = 40 students lies in the interval 10-20 and so on. The table of a frequency distribution for the given data is