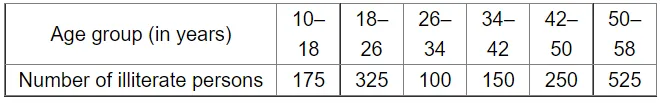
The following table shows the number of illiterate persons in the age group (10–58 years) in a town.

Question:
The following table shows the number of illiterate persons in the age group (10–58 years) in a town. Represent the given data by means of a histogram.
Hint. Take 1 small division = 5 persons.
Solution:
.webp)