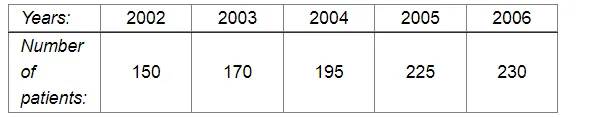
The following table shows the number of patients discharged from a hospital with HIV diagnosis in different years:

Question:
The following table shows the number of patients discharged from a hospital with HIV diagnosis in different years:
Represent this information by a graph.
Solution:
Here, years is an independent variable and the number of patients is a dependent variable. So, we take years on the x-axis and the number of patients on the y-axis.
Let us choose the following scale:
On x-axis: 2 cm = 1 year
On y-axis: 1 cm = 10 patients
Also, let us assume that on the x-axis, origin (O) represents 2001 and on the y-axis, origin (O) represents 120, i.e. O (2001, 120).
Now, let us plot (2002, 150), (2003, 170), (2004, 195), (2005, 225), (2006, 230). These points are joined to get the graph representing the given information as shown in the figure below.
.webp)