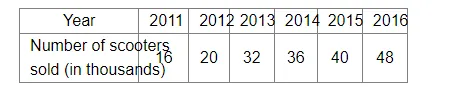
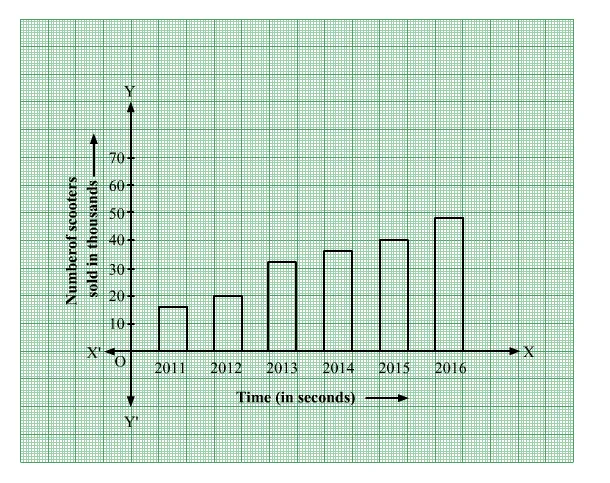
The following table shows the number of scooters sold by a dealer during six consecutive years. Draw a bar graph to represent this data.
Leave a comment
All Study Material