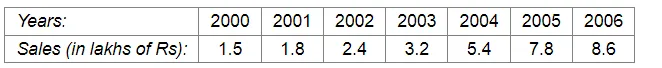
The following table shows the sales of a commodity during the years 2000 to 2006.

Question:
The following table shows the sales of a commodity during the years 2000 to 2006.
Draw a graph of this information.
Solution:
Here, year is an independent variable and sales is a dependent variable. So, we take year on the x-axis and sales on the y-axis.
Let us choose the following scale:
On x-axis: 2 cm = 1 year
On y-axis: 2 cm = 1 lakh rupees
Assume that on x-axis, origin (O) represents 1991.
So, the coordinates of O are (1991,0).
Now, let us plot (2000, 1.5), (2001, 1.8), (2002, 2.4), (2003, 3.2), (2004, 5.4), (2005, 7.8) and (2006, 8.6). These points are joined to get the graph representing the given information as shown in the figure below..webp)