The heights of 75 students in a school are given below:

Question:
The heights of 75 students in a school are given below:

Draw a histogram to represent the above data.
Solution:
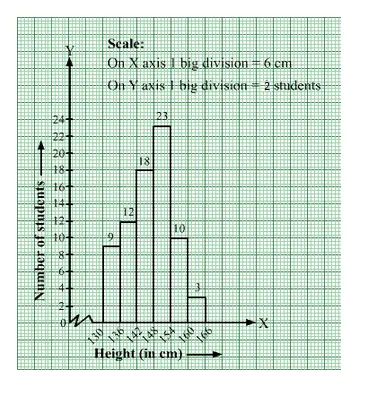
The given frequency distribution is in exclusive form.
We will represent the class intervals [heights (in cm)] along the x-axis & the corresponding frequencies [number of students ] along the y-axis.
The scale is as follows:
On x-axis: 1 big division = 6 cm
On y-axis: 1 big division = 2 students
Because the scale on the x-axis starts at 130, a kink, i.e., a break, is indicated near the origin to signify that the graph is drawn with a scale beginning at 130
and not at the origin.
We will construct rectangles with the class intervals as bases and the corresponding frequencies as heights.
Thus, we will obtain the following histogram: