
Question:
The marks obtained (out of 20) by 30 students of a class in a test are given below:
7, 10, 8, 16, 13, 14, 15, 11, 18, 11, 15, 10, 7, 14, 20, 19, 15, 16, 14, 20, 10, 11, 14, 17, 13, 12, 15, 14, 16, 17.
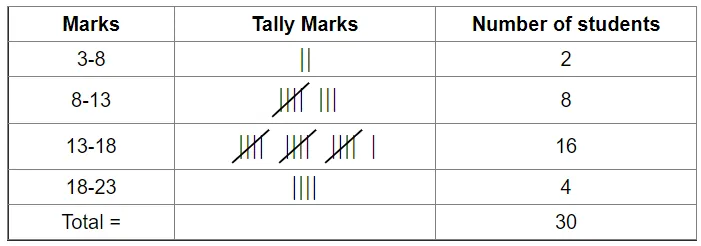
Prepare a frequency distribution table for the above data using class intervals of equal width in which one class interval in 3–8(including 2 and excluding 8). From the frequency distribution table so obtained, draw a histogram.
Solution:
Frequency distribution table
(2).webp)