
Question.
The relative humidity (in %) of a certain city for a month of 30 days was as follows:
98.1 98.6 99.2 90.3 86.5 95.3 92.9 96.3 94.2 95.1
89.2 92.3 97.1 93.5 92.7 95.1 97.2 93.3 95.2 97.3
96.2 92.1 84.9 90.2 95.7 98.3 97.3 96.1 92.1 89
(i) Construct a grouped frequency distribution table with classes
84 - 86, 86 - 88
(ii) Which month or season do you think this data is about?
(iii) What is the range of this data?
Solution:
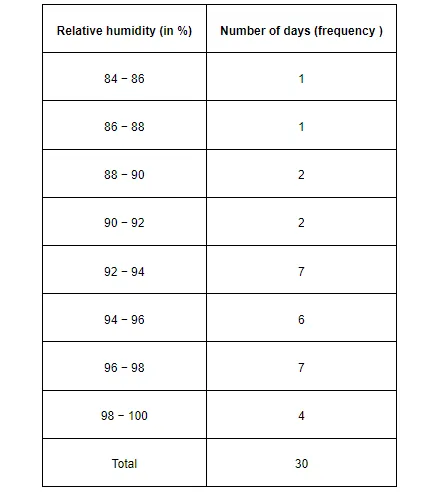
(i) A grouped frequency distribution table of class size 2 has to be constructed. The class intervals will be 84 − 86, 86 − 88, and 88 − 90…
By observing the data given above, the required table can be constructed as follows.
(ii) It can be observed that the relative humidity is high. Therefore, the data is about a month of rainy season.
(iii) Range of data = Maximum value − Minimum value
$=99.2-84.9=14.3$