Using following data, draw time-displacement graph for a moving object:

Question:
Using following data, draw time-displacement graph for a moving object:
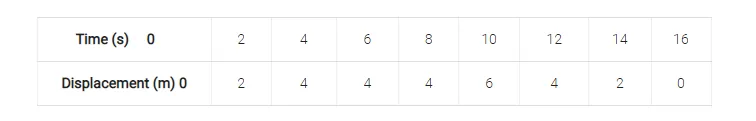
Use this graph to find average velocity for first $4 \mathrm{~s}$, for next $4 \mathrm{~s}$ and for last $6 \mathrm{~s}$.
Solution:
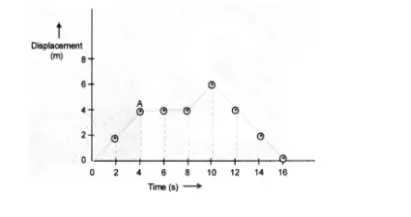
Displacement-time graph is shown in figure 8 .
Average velocity for first $4 \mathrm{~s}$ = Slope of displacement-time graph
(i.e. OA part) $=\frac{4 m}{4 s}=1 \mathrm{~ms}^{-1}$
Average velocity for next $4 s$ (i.e. in the interval of $4 s$ to $8 s$ ) = zero.
Average velocity for last $6 s=\frac{(0-6) m}{(16-10) s}=-1 \mathrm{~ms}^{-1}$