
Question:
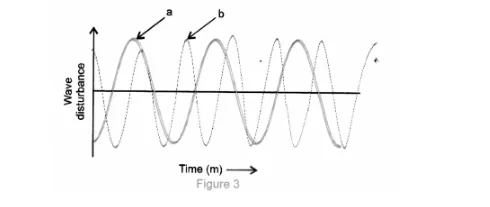
Which of the above two graphs (a) and (b) (Fig. 3) representing the human voice is likely to be the male voice ? Give reason for your answer.
Solution:
Frequency of male voice is lesser than that of female voice. So, graph (a) represents the human voice.