
Question:
Which of the following graphs represents a one-one function?
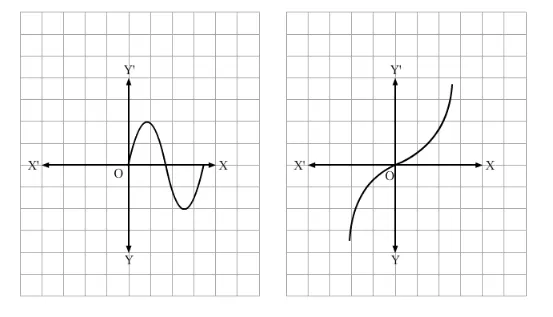
Solution:
In the graph of (b), different elements on the x-axis have different images on the y-axis.
But in (a), the graph cuts the x-axis at 3 points, which means that 3 points on the x-axis have the same image as 0 and hence, it is not one-one.