Which one of the following given graphs represents the variation of rate constant

Question:
Which one of the following given graphs represents the variation of rate constant $(\mathrm{k})$ with temperature (T) for an endothermic reaction ?
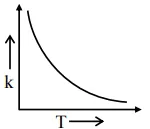
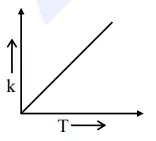
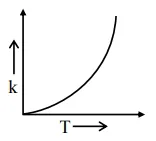
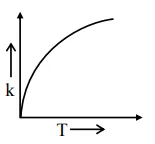
Correct Option: , 3
Solution:
By observation we get this plot during measurable temperatures
Ans. $3^{\text {rd }}$ Option.