NCERT Solutions for Class 9 Maths chapter 14 Exercise 14.2 - Statistics

Hey, are you a class 9 Student and Looking for Ways to Download NCERT Solutions for Class 9 Maths chapter 14 Exercise 14.2? If Yes then you are at the right place.
Here we have listed Class 9 maths chapter 14 exercise 14.2 solutions in PDF that is prepared by Kota’s top IITian’s Faculties by keeping Simplicity in mind.
If you want to score high in your class 9 Maths Exam then it is very important for you to have a good knowledge of all the important topics, so to learn and practice those topics you can use eSaral NCERT Solutions.
In this article, we have listed NCERT Solutions for Class 9 Maths chapter 14 Exercise 14.2 that you can download to start your preparations anytime.
So, without wasting more time Let’s start.Download The PDF of NCERT Solutions for Class 9 Maths chapter 14 Exercise 14.2 "Statistics"
So, that’s all from this article. I hope you enjoyed this post. If you found this article helpful then please share it with other students.
Q1. The blood groups of 30 students of Class VIII are recorded as follows:
$\mathrm{A}, \mathrm{B}, \mathrm{O}, \mathrm{O}, \mathrm{AB}, \mathrm{O}, \mathrm{A}, \mathrm{O}, \mathrm{B}, \mathrm{A}, \mathrm{O}, \mathrm{B}, \mathrm{A}, \mathrm{O}, \mathrm{O}$
$\mathrm{A}, \mathrm{AB}, \mathrm{O}, \mathrm{A}, \mathrm{A}, \mathrm{O}, \mathrm{O}, \mathrm{AB}, \mathrm{B}, \mathrm{A}, \mathrm{O}, \mathrm{B}, \mathrm{A}, \mathrm{B}, \mathrm{O} .$
Represent this data in the form of a frequency distribution table. Which is the most common, and which is the rarest, blood group among these students?
\begin{aligned}
&\text
{Q2. The distance (in} \mathrm{km} \text {) of} 40 \text {engineers from their residence to their place of work were found as} \\
&\begin{array}{llllllllll}
\text {follows:} & & & & & & & & \\ 5 & 3 & 10 & 20 & 25 & 11 & 13 & 7 & 12 & 31 \\ 19 & 10 & 12 & 17 & 18 & 11 & 32 & 17 & 16 & 2 \\ 7 & 9 & 7 & 8 & 3 & 5 & 12 & 15 & 18 & 3 \\ 12 & 14 & 2 & 9 & 6 & 15 & 15 & 7 & 6 & 12
\end{array}
\end{aligned}
Construct a grouped frequency distribution table with class size 5 for the data given above taking the first interval as $0-5$ (5 not included). What main features do you observe from this tabular representation?
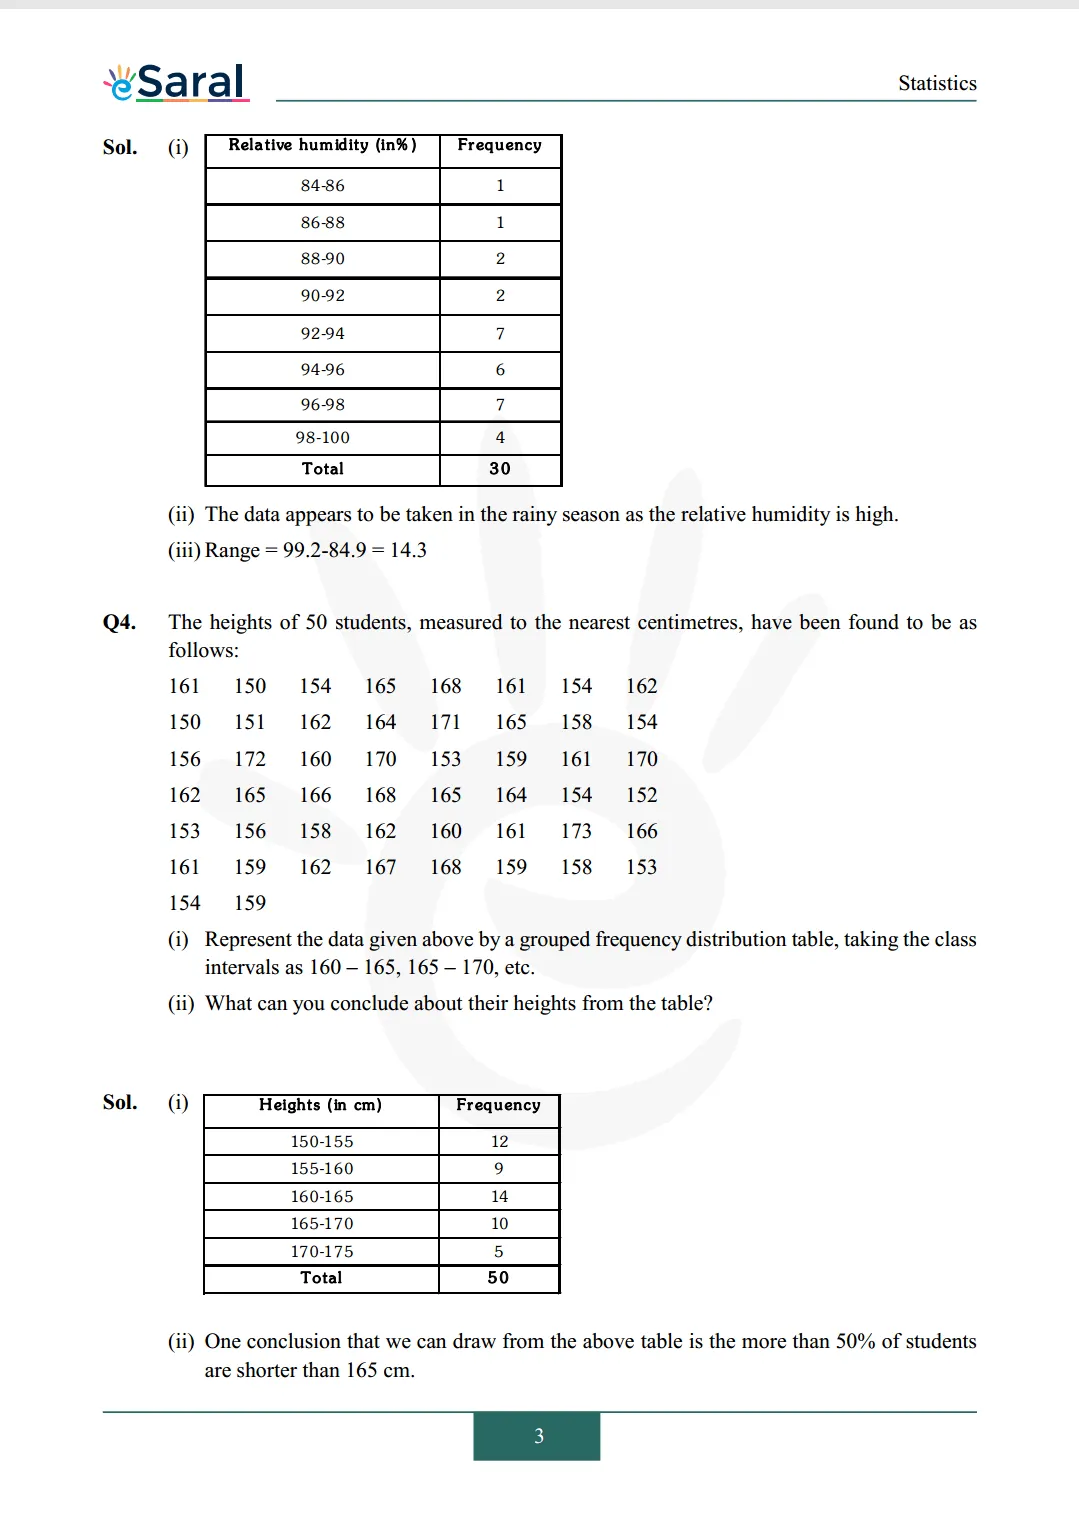
Q3. The relative humidity (in %) of a certain city for a month of 30 days was as follows:
$\begin{array}{lllllllllll}98.1 & 98.6 & 99.2 & 90.3 & 86.5 & 95.3 & 92.9 & 96.3 & 94.2 & 95.1 & 89.2 \\ 92.3 & 97.1 & 93.5 & 92.7 & 95.1 & 97.2 & 93.3 & 95.2 & 97.3 & 96.2 & 92.1 \\ 84.9 & 90.2 & 95.7 & 98.3 & 97.3 & 96.1 & 92.1 & 89 & & & \end{array}$
(i) Construct a grouped frequency distribution table with classes $84-86,86-88$, etc.
(ii) Which month or season do you think this data is about?
(iii) What is the range of this data?
Q4. The heights of 50 students, measured to the nearest centimetres, have been found to be as follows:
$\begin{array}{llllllll}161 & 150 & 154 & 165 & 168 & 161 & 154 & 162 \\ 150 & 151 & 162 & 164 & 171 & 165 & 158 & 154 \\ 156 & 172 & 160 & 170 & 153 & 159 & 161 & 170 \\ 162 & 165 & 166 & 168 & 165 & 164 & 154 & 152 \\ 153 & 156 & 158 & 162 & 160 & 161 & 173 & 166 \\ 161 & 159 & 162 & 167 & 168 & 159 & 158 & 153 \\ 154 & 159 & & & & & & \end{array}$
(i) Represent the data given above by a grouped frequency distribution table, taking the class intervals as $160-165,165-170$, etc.
(ii) What can you conclude about their heights from the table?
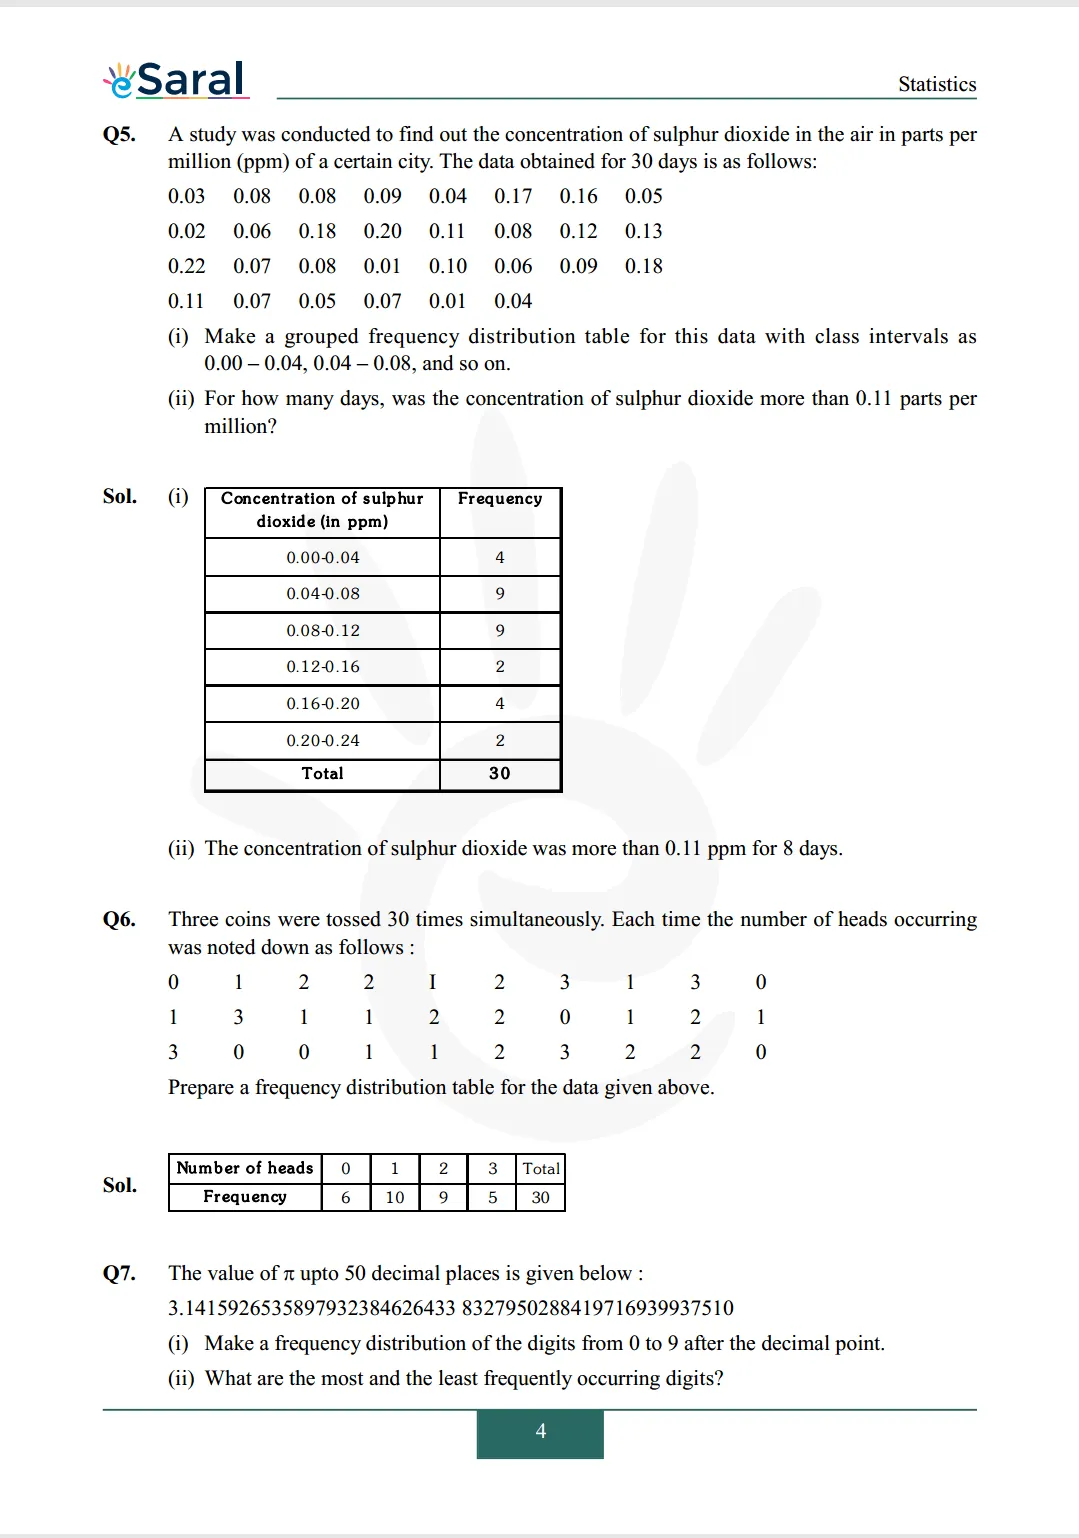
Q5. A study was conducted to find out the concentration of sulphur dioxide in the air in parts per million (ppm) of a certain city. The data obtained for 30 days is as follows:
$\begin{array}{llllllll}0.03 & 0.08 & 0.08 & 0.09 & 0.04 & 0.17 & 0.16 & 0.05 \\ 0.02 & 0.06 & 0.18 & 0.20 & 0.11 & 0.08 & 0.12 & 0.13 \\ 0.22 & 0.07 & 0.08 & 0.01 & 0.10 & 0.06 & 0.09 & 0.18 \\ 0.11 & 0.07 & 0.05 & 0.07 & 0.01 & 0.04 & & \end{array}$
(i) Make a grouped frequency distribution table for this data with class intervals as $0.00-0.04,0.04-0.08$, and so on.
(ii) For how many days, was the concentration of sulphur dioxide more than $0.11$ parts per million?
Q6. Three coins were tossed 30 times simultaneously. Each time the number of heads occurring was noted down as follows:
$\begin{array}{rrrrrrrrrr}0 & 1 & 2 & 2 & \mathrm{I} & 2 & 3 & 1 & 3 & 0 \\ 1 & 3 & 1 & 1 & 2 & 2 & 0 & 1 & 2 & 1 \\ 3 & 0 & 0 & 1 & 1 & 2 & 3 & 2 & 2 & 0\end{array}$ Prepare a frequency distribution table for the data given above.
Q7. The value of $\pi$ upto 50 decimal places is given below:
$3.14159265358979323846264338327950288419716939937510$
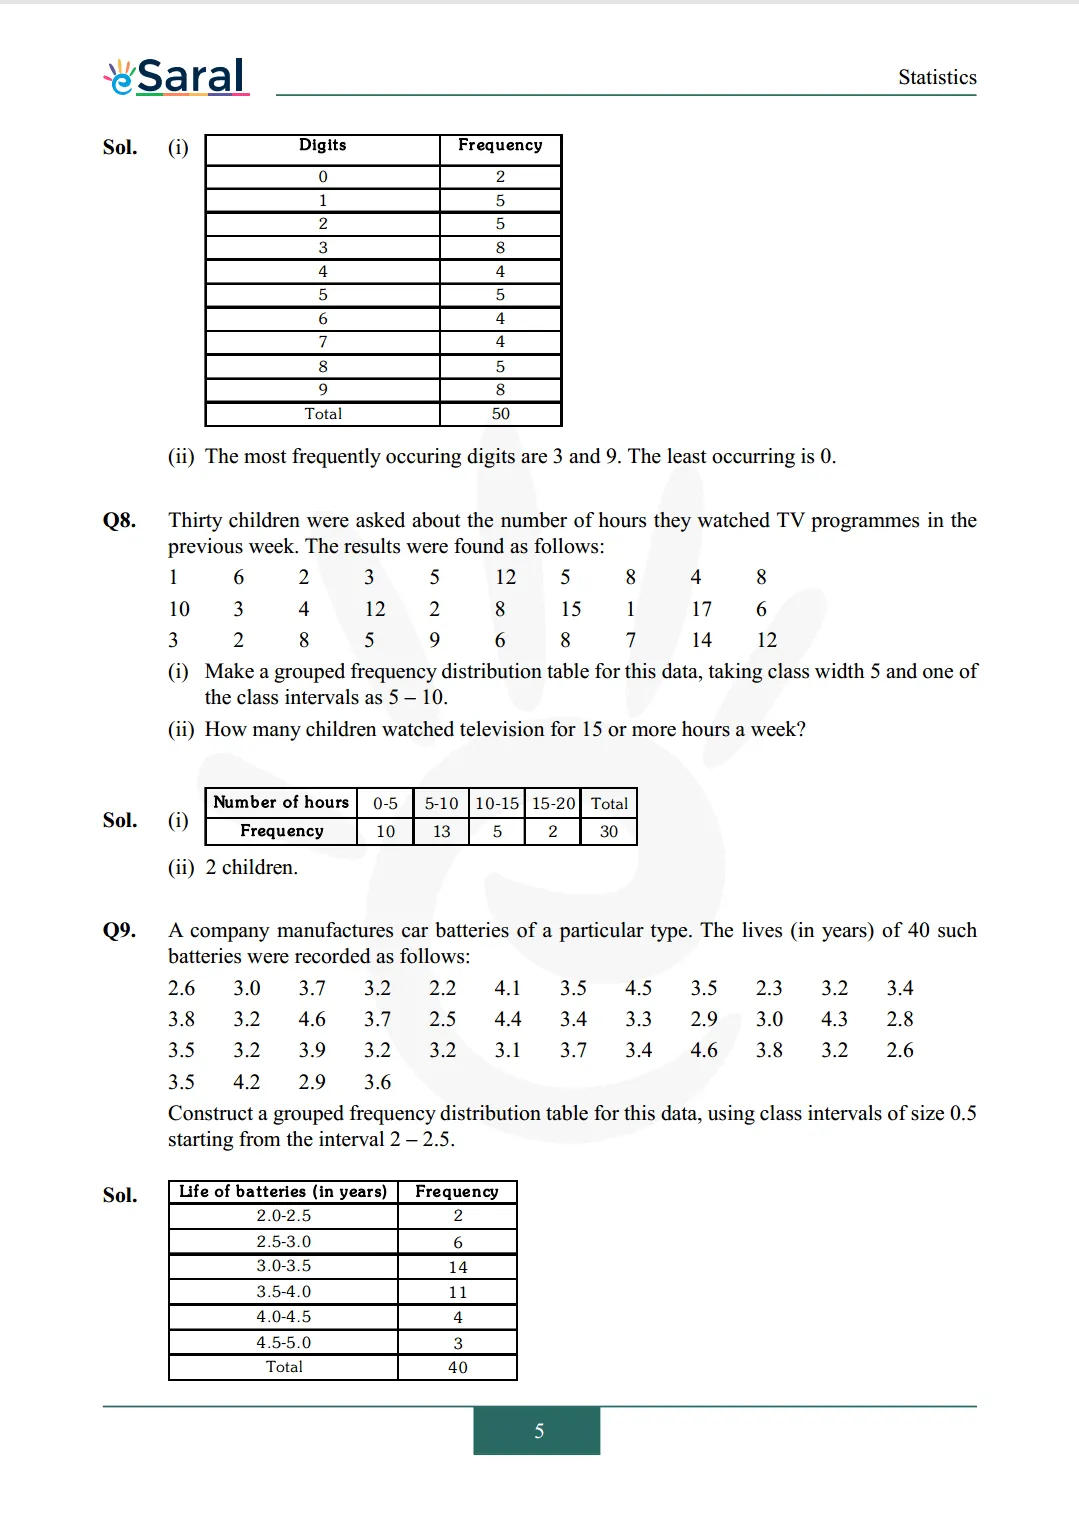
(i) Make a frequency distribution of the digits from 0 to 9 after the decimal point.
(ii) What are the most and the least frequently occurring digits?
Q8. Thirty children were asked about the number of hours they watched TV programmes in the previous week. The results were found as follows:
$\begin{array}{llllllllll}1 & 6 & 2 & 3 & 5 & 12 & 5 & 8 & 4 & 8 \\ 10 & 3 & 4 & 12 & 2 & 8 & 15 & 1 & 17 & 6 \\ 3 & 2 & 8 & 5 & 9 & 6 & 8 & 7 & 14 & 12\end{array}$
(i) Make a grouped frequency distribution table for this data, taking class width 5 and one of the class intervals as $5-10$.
(ii) How many children watched television for 15 or more hours a week?
Q9. A company manufactures car batteries of a particular type. The lives (in years) of 40 such batteries were recorded as follows:
$\begin{array}{llllllllllll}2.6 & 3.0 & 3.7 & 3.2 & 2.2 & 4.1 & 3.5 & 4.5 & 3.5 & 2.3 & 3.2 & 3.4 \\ 3.8 & 3.2 & 4.6 & 3.7 & 2.5 & 4.4 & 3.4 & 3.3 & 2.9 & 3.0 & 4.3 & 2.8 \\ 3.5 & 3.2 & 3.9 & 3.2 & 3.2 & 3.1 & 3.7 & 3.4 & 4.6 & 3.8 & 3.2 & 2.6 \\ 3.5 & 4.2 & 2.9 & 3.6 & & & & & & & & \end{array}$
Construct a grouped frequency distribution table for this data, using class intervals of size $0.5$ starting from the interval $2-2.5$.
Also Read,
Download NCERT Class 9 Maths Book PDF
Download NCERT Class 9 Maths Exemplar PDF
Download Complete Solutions for Class 9 Maths chapter 14 PDF
Download Class 9 Maths Chapter 13 Exercise 13.1 Solutions PDF
Download Class 9 Maths Chapter 13 Exercise 13.2 Solutions PDF
Download Class 9 Maths Chapter 13 Exercise 13.3 Solutions PDF
Download Class 9 Maths Chapter 13 Exercise 13.4 Solutions PDF
If you have any Confusion related to NCERT Solutions for Class 9 Maths chapter 14 Exercise 14.2 then feel free to ask in the comments section down below.
To watch Free Learning Videos on Class 9 by Kota’s top Faculties Install the eSaral App
Here we have listed Class 9 maths chapter 14 exercise 14.2 solutions in PDF that is prepared by Kota’s top IITian’s Faculties by keeping Simplicity in mind.
If you want to score high in your class 9 Maths Exam then it is very important for you to have a good knowledge of all the important topics, so to learn and practice those topics you can use eSaral NCERT Solutions.
In this article, we have listed NCERT Solutions for Class 9 Maths chapter 14 Exercise 14.2 that you can download to start your preparations anytime.
So, without wasting more time Let’s start.
Download The PDF of NCERT Solutions for Class 9 Maths chapter 14 Exercise 14.2 "Statistics"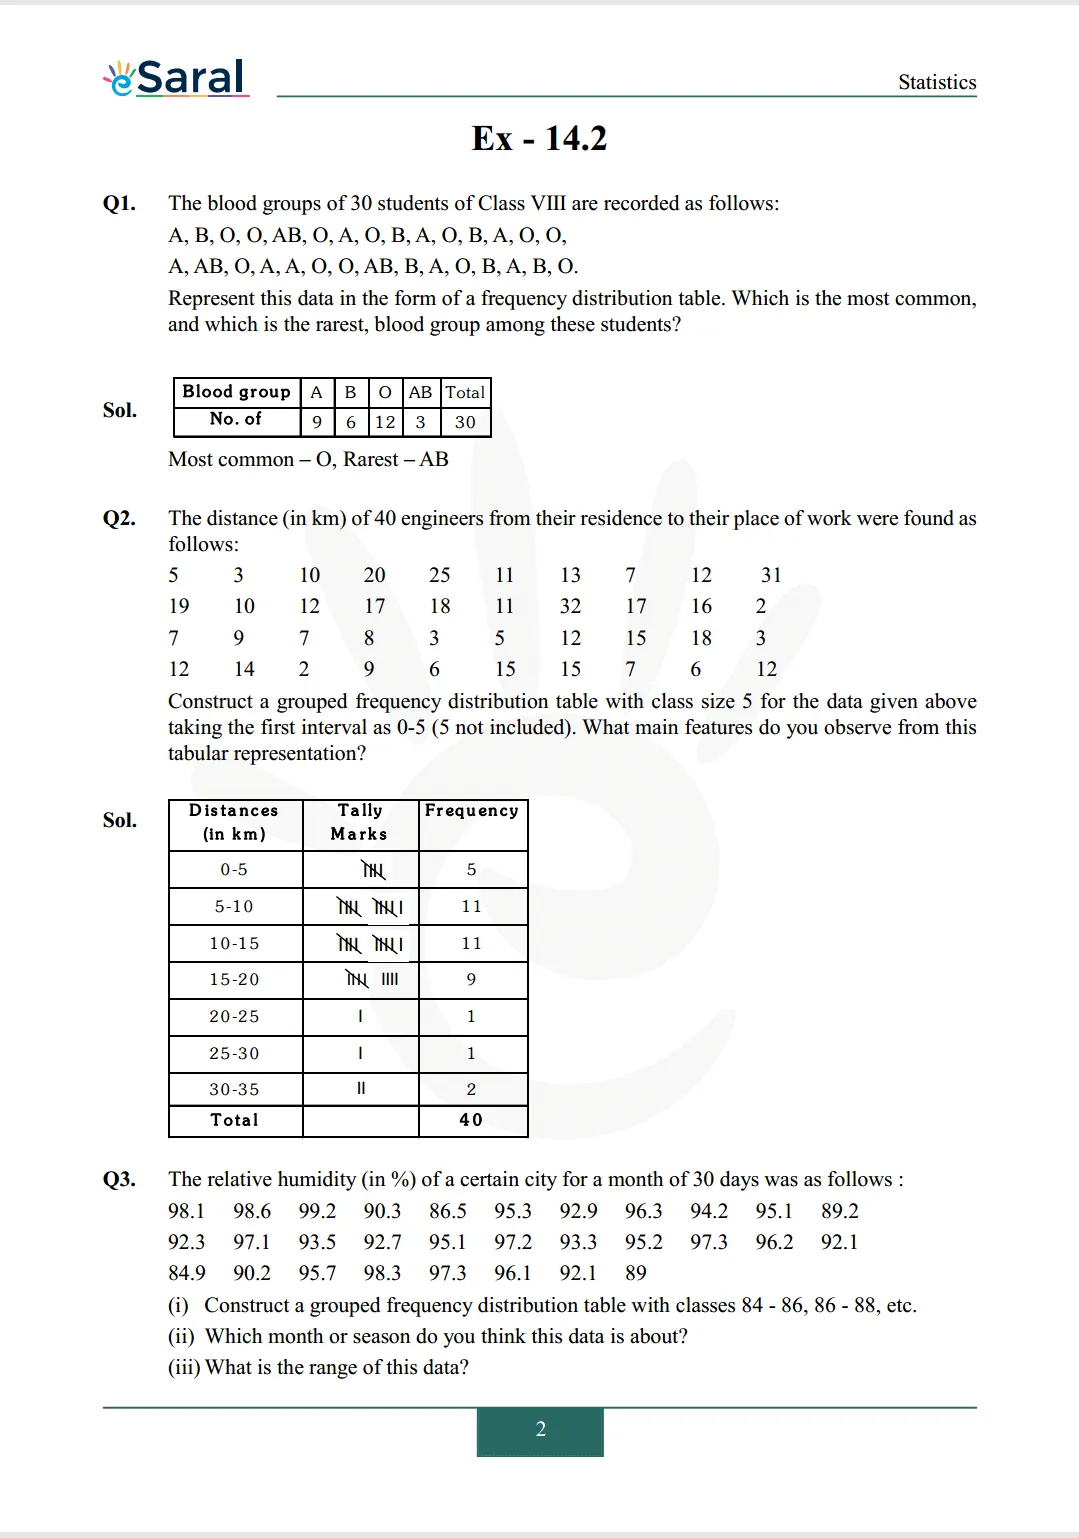
So, that’s all from this article. I hope you enjoyed this post. If you found this article helpful then please share it with other students.
All Questions of Chapter 14 Exercise 14.2
Once you complete the chapter 14 then you can revise Ex. 14.2 by solving following questions
Q1. The blood groups of 30 students of Class VIII are recorded as follows:
$\mathrm{A}, \mathrm{B}, \mathrm{O}, \mathrm{O}, \mathrm{AB}, \mathrm{O}, \mathrm{A}, \mathrm{O}, \mathrm{B}, \mathrm{A}, \mathrm{O}, \mathrm{B}, \mathrm{A}, \mathrm{O}, \mathrm{O}$
$\mathrm{A}, \mathrm{AB}, \mathrm{O}, \mathrm{A}, \mathrm{A}, \mathrm{O}, \mathrm{O}, \mathrm{AB}, \mathrm{B}, \mathrm{A}, \mathrm{O}, \mathrm{B}, \mathrm{A}, \mathrm{B}, \mathrm{O} .$
Represent this data in the form of a frequency distribution table. Which is the most common, and which is the rarest, blood group among these students?
\begin{aligned}
&\text
{Q2. The distance (in} \mathrm{km} \text {) of} 40 \text {engineers from their residence to their place of work were found as} \\
&\begin{array}{llllllllll}
\text {follows:} & & & & & & & & \\ 5 & 3 & 10 & 20 & 25 & 11 & 13 & 7 & 12 & 31 \\ 19 & 10 & 12 & 17 & 18 & 11 & 32 & 17 & 16 & 2 \\ 7 & 9 & 7 & 8 & 3 & 5 & 12 & 15 & 18 & 3 \\ 12 & 14 & 2 & 9 & 6 & 15 & 15 & 7 & 6 & 12
\end{array}
\end{aligned}
Construct a grouped frequency distribution table with class size 5 for the data given above taking the first interval as $0-5$ (5 not included). What main features do you observe from this tabular representation?
Q3. The relative humidity (in %) of a certain city for a month of 30 days was as follows:
$\begin{array}{lllllllllll}98.1 & 98.6 & 99.2 & 90.3 & 86.5 & 95.3 & 92.9 & 96.3 & 94.2 & 95.1 & 89.2 \\ 92.3 & 97.1 & 93.5 & 92.7 & 95.1 & 97.2 & 93.3 & 95.2 & 97.3 & 96.2 & 92.1 \\ 84.9 & 90.2 & 95.7 & 98.3 & 97.3 & 96.1 & 92.1 & 89 & & & \end{array}$
(i) Construct a grouped frequency distribution table with classes $84-86,86-88$, etc.
(ii) Which month or season do you think this data is about?
(iii) What is the range of this data?
Q4. The heights of 50 students, measured to the nearest centimetres, have been found to be as follows:
$\begin{array}{llllllll}161 & 150 & 154 & 165 & 168 & 161 & 154 & 162 \\ 150 & 151 & 162 & 164 & 171 & 165 & 158 & 154 \\ 156 & 172 & 160 & 170 & 153 & 159 & 161 & 170 \\ 162 & 165 & 166 & 168 & 165 & 164 & 154 & 152 \\ 153 & 156 & 158 & 162 & 160 & 161 & 173 & 166 \\ 161 & 159 & 162 & 167 & 168 & 159 & 158 & 153 \\ 154 & 159 & & & & & & \end{array}$
(i) Represent the data given above by a grouped frequency distribution table, taking the class intervals as $160-165,165-170$, etc.
(ii) What can you conclude about their heights from the table?
Q5. A study was conducted to find out the concentration of sulphur dioxide in the air in parts per million (ppm) of a certain city. The data obtained for 30 days is as follows:
$\begin{array}{llllllll}0.03 & 0.08 & 0.08 & 0.09 & 0.04 & 0.17 & 0.16 & 0.05 \\ 0.02 & 0.06 & 0.18 & 0.20 & 0.11 & 0.08 & 0.12 & 0.13 \\ 0.22 & 0.07 & 0.08 & 0.01 & 0.10 & 0.06 & 0.09 & 0.18 \\ 0.11 & 0.07 & 0.05 & 0.07 & 0.01 & 0.04 & & \end{array}$
(i) Make a grouped frequency distribution table for this data with class intervals as $0.00-0.04,0.04-0.08$, and so on.
(ii) For how many days, was the concentration of sulphur dioxide more than $0.11$ parts per million?
Q6. Three coins were tossed 30 times simultaneously. Each time the number of heads occurring was noted down as follows:
$\begin{array}{rrrrrrrrrr}0 & 1 & 2 & 2 & \mathrm{I} & 2 & 3 & 1 & 3 & 0 \\ 1 & 3 & 1 & 1 & 2 & 2 & 0 & 1 & 2 & 1 \\ 3 & 0 & 0 & 1 & 1 & 2 & 3 & 2 & 2 & 0\end{array}$ Prepare a frequency distribution table for the data given above.
Q7. The value of $\pi$ upto 50 decimal places is given below:
$3.14159265358979323846264338327950288419716939937510$
(i) Make a frequency distribution of the digits from 0 to 9 after the decimal point.
(ii) What are the most and the least frequently occurring digits?
Q8. Thirty children were asked about the number of hours they watched TV programmes in the previous week. The results were found as follows:
$\begin{array}{llllllllll}1 & 6 & 2 & 3 & 5 & 12 & 5 & 8 & 4 & 8 \\ 10 & 3 & 4 & 12 & 2 & 8 & 15 & 1 & 17 & 6 \\ 3 & 2 & 8 & 5 & 9 & 6 & 8 & 7 & 14 & 12\end{array}$
(i) Make a grouped frequency distribution table for this data, taking class width 5 and one of the class intervals as $5-10$.
(ii) How many children watched television for 15 or more hours a week?
Q9. A company manufactures car batteries of a particular type. The lives (in years) of 40 such batteries were recorded as follows:
$\begin{array}{llllllllllll}2.6 & 3.0 & 3.7 & 3.2 & 2.2 & 4.1 & 3.5 & 4.5 & 3.5 & 2.3 & 3.2 & 3.4 \\ 3.8 & 3.2 & 4.6 & 3.7 & 2.5 & 4.4 & 3.4 & 3.3 & 2.9 & 3.0 & 4.3 & 2.8 \\ 3.5 & 3.2 & 3.9 & 3.2 & 3.2 & 3.1 & 3.7 & 3.4 & 4.6 & 3.8 & 3.2 & 2.6 \\ 3.5 & 4.2 & 2.9 & 3.6 & & & & & & & & \end{array}$
Construct a grouped frequency distribution table for this data, using class intervals of size $0.5$ starting from the interval $2-2.5$.
Also Read,
Download NCERT Class 9 Maths Book PDF
Download NCERT Class 9 Maths Exemplar PDF
Download Complete Solutions for Class 9 Maths chapter 14 PDF
Download Class 9 Maths Chapter 13 Exercise 13.1 Solutions PDF
Download Class 9 Maths Chapter 13 Exercise 13.2 Solutions PDF
Download Class 9 Maths Chapter 13 Exercise 13.3 Solutions PDF
Download Class 9 Maths Chapter 13 Exercise 13.4 Solutions PDF
If you have any Confusion related to NCERT Solutions for Class 9 Maths chapter 14 Exercise 14.2 then feel free to ask in the comments section down below.
To watch Free Learning Videos on Class 9 by Kota’s top Faculties Install the eSaral App