NCERT Solutions for Class 9 Maths chapter 14 Exercise 14.3 - Statistics

Hey, are you a class 9 Student and Looking for Ways to Download NCERT Solutions for Class 9 Maths chapter 14 Exercise 14.3? If Yes then you are at the right place.
Here we have listed Class 9 maths chapter 14 exercise 14.3 solutions in PDF that is prepared by Kota’s top IITian’s Faculties by keeping Simplicity in mind.
If you want to score high in your class 9 Maths Exam then it is very important for you to have a good knowledge of all the important topics, so to learn and practice those topics you can use eSaral NCERT Solutions.
In this article, we have listed NCERT Solutions for Class 9 Maths chapter 14 Exercise 14.3 that you can download to start your preparations anytime.
India's Best Exam Preparation for Class 9th - Download Now
So, without wasting more time Let’s start.
Download The PDF of NCERT Solutions for Class 9 Maths chapter 14 Exercise 14.3 "Statistics"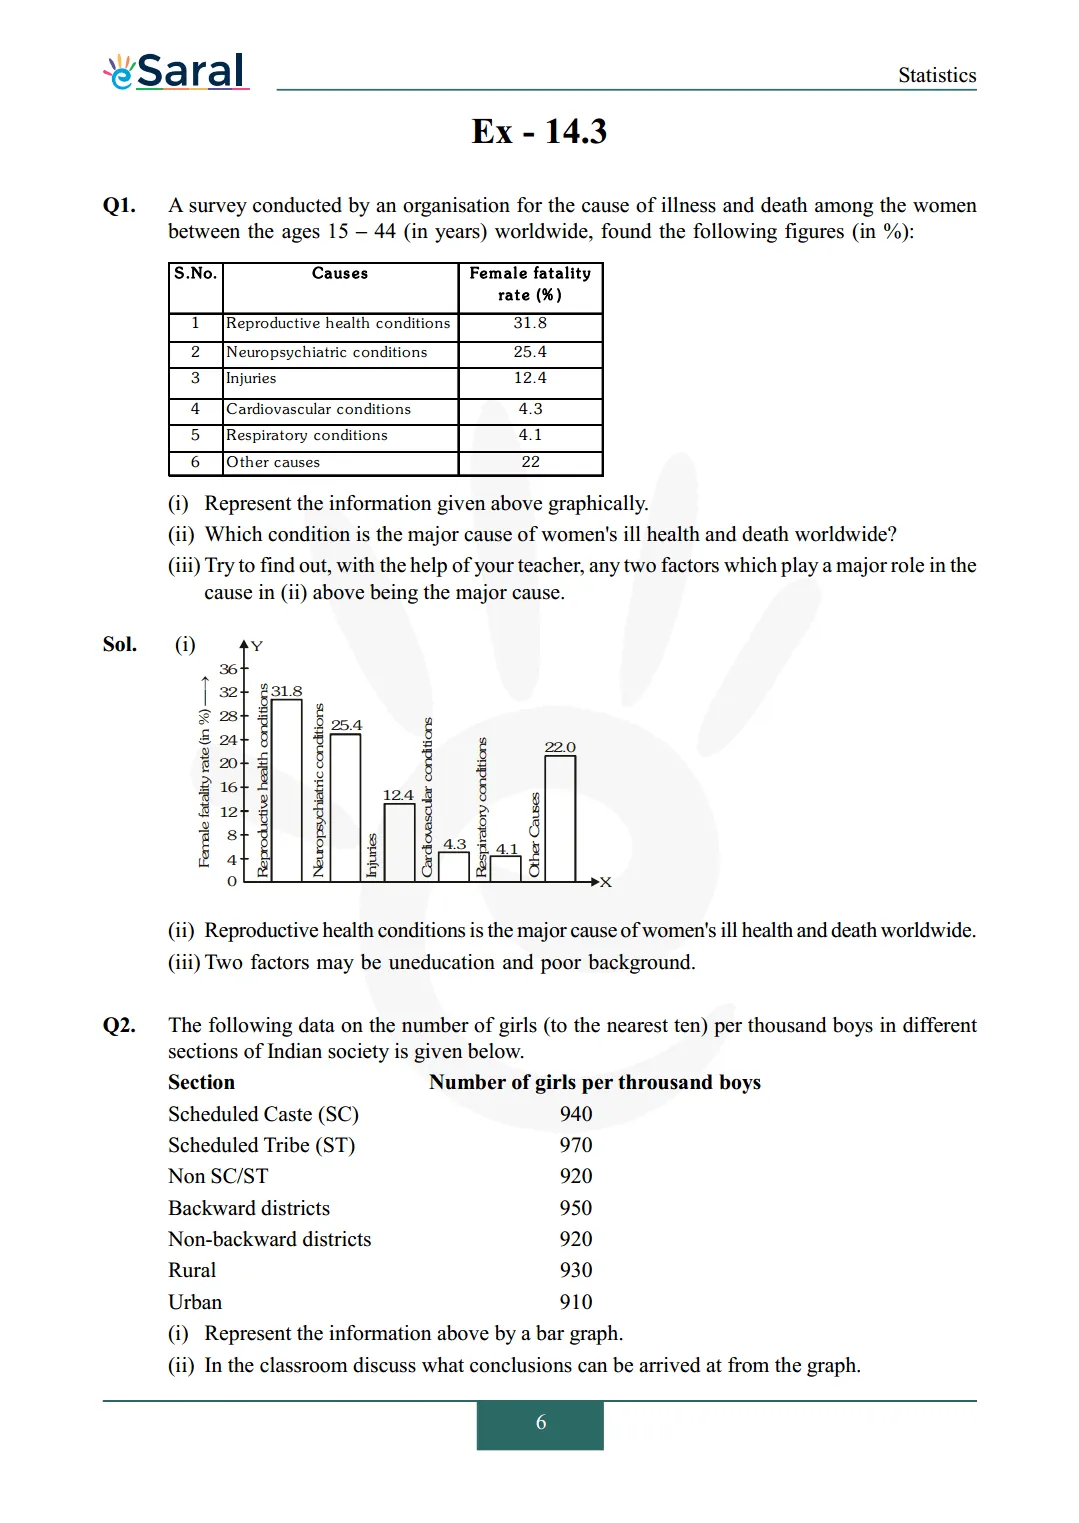
So, that’s all from this article. I hope you enjoyed this post. If you found this article helpful then please share it with other students.
India's Best Exam Preparation for Class 9th - Download Now
All Questions of Chapter 14 Exercise 14.3
Once you complete the chapter 14 then you can revise Ex. 14.3 by solving following questions
Q1. A survey conducted by an organization for the cause of illness and death among the women between the ages 15 – 44 (in years) worldwide, found the following figures (in %): 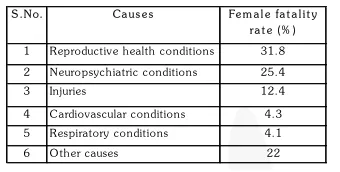
(i) Represent the information given above graphically.
(ii) Which condition is the major cause of women's ill health and death worldwide?
(iii) Try to find out, with the help of your teacher, any two factors which play a major role in the cause in (ii) above being the major cause.
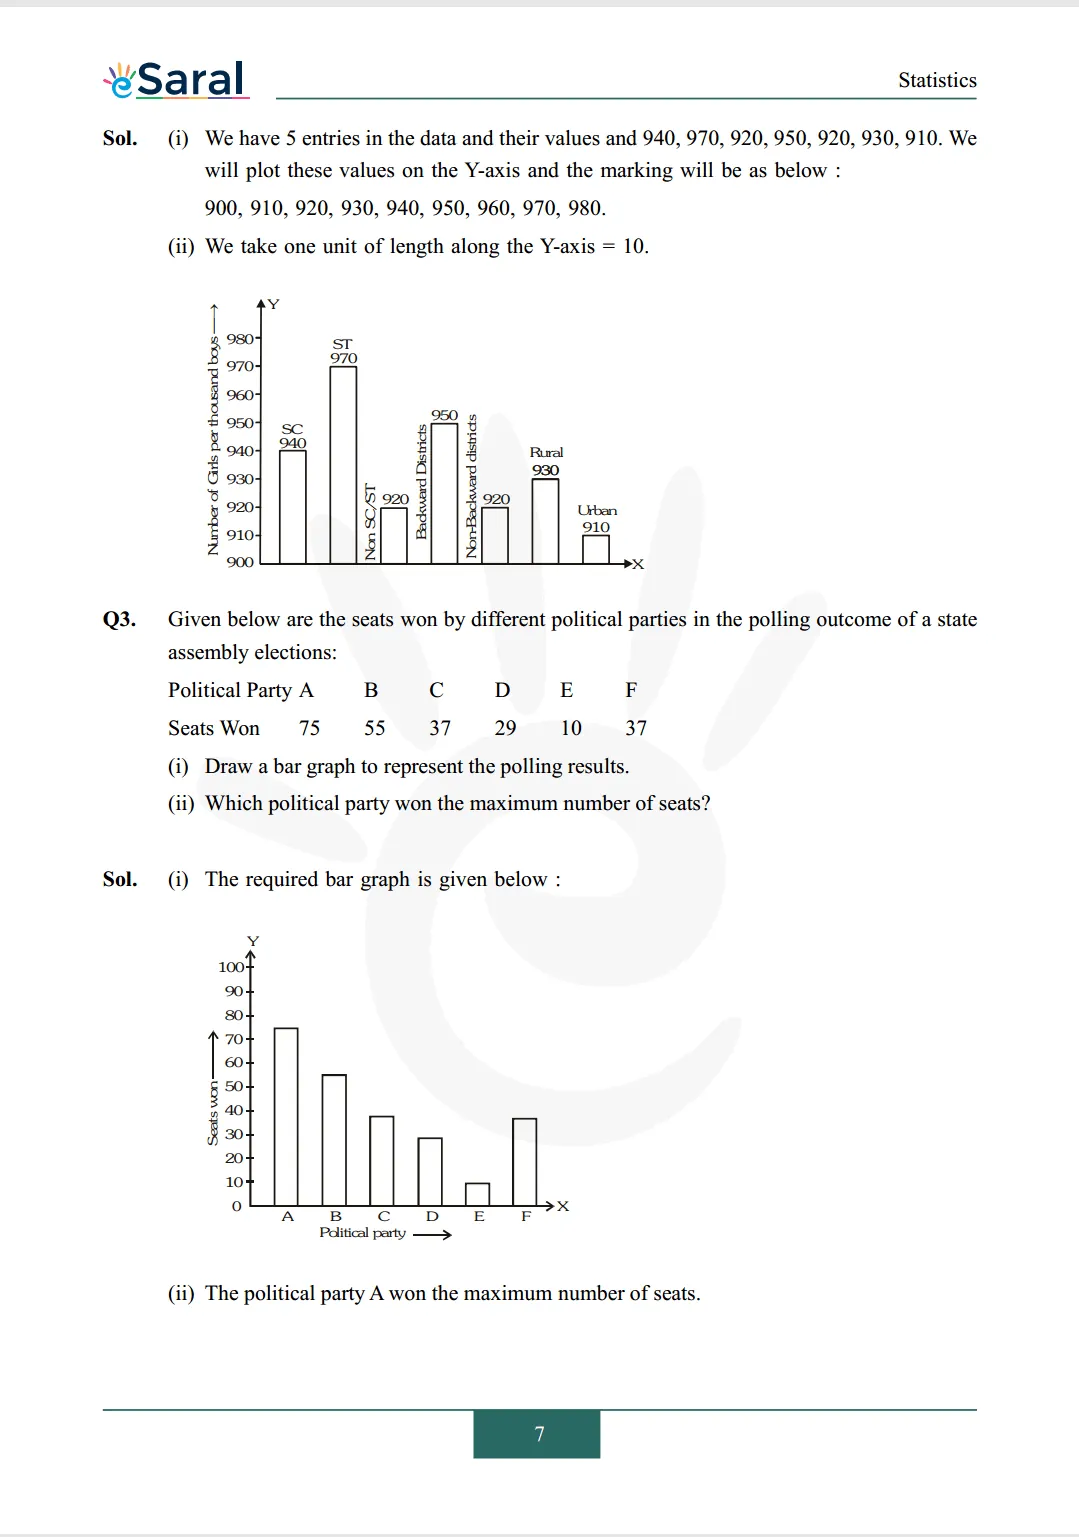
Q2. The following data on the number of girls (to the nearest ten) per thousand boys in different sections of Indian society is given below.
$\begin{array}{lc}\text {Section} & \text {Number of girls per throusand boys} \\ \text {Scheduled Caste (SC) } & 940 \\ \text { Scheduled Tribe (ST) } & 970 \\ \text { Non SC/ST } & 920 \\ \text { Backward districts } & 950 \\ \text { Non-backward districts } & 920 \\ \text { Rural } & 930 \\ \text { Urban } & 910\end{array}$
(i) Represent the information above by a bar graph.
(ii) In the classroom discuss what conclusions can be arrived at from the graph.
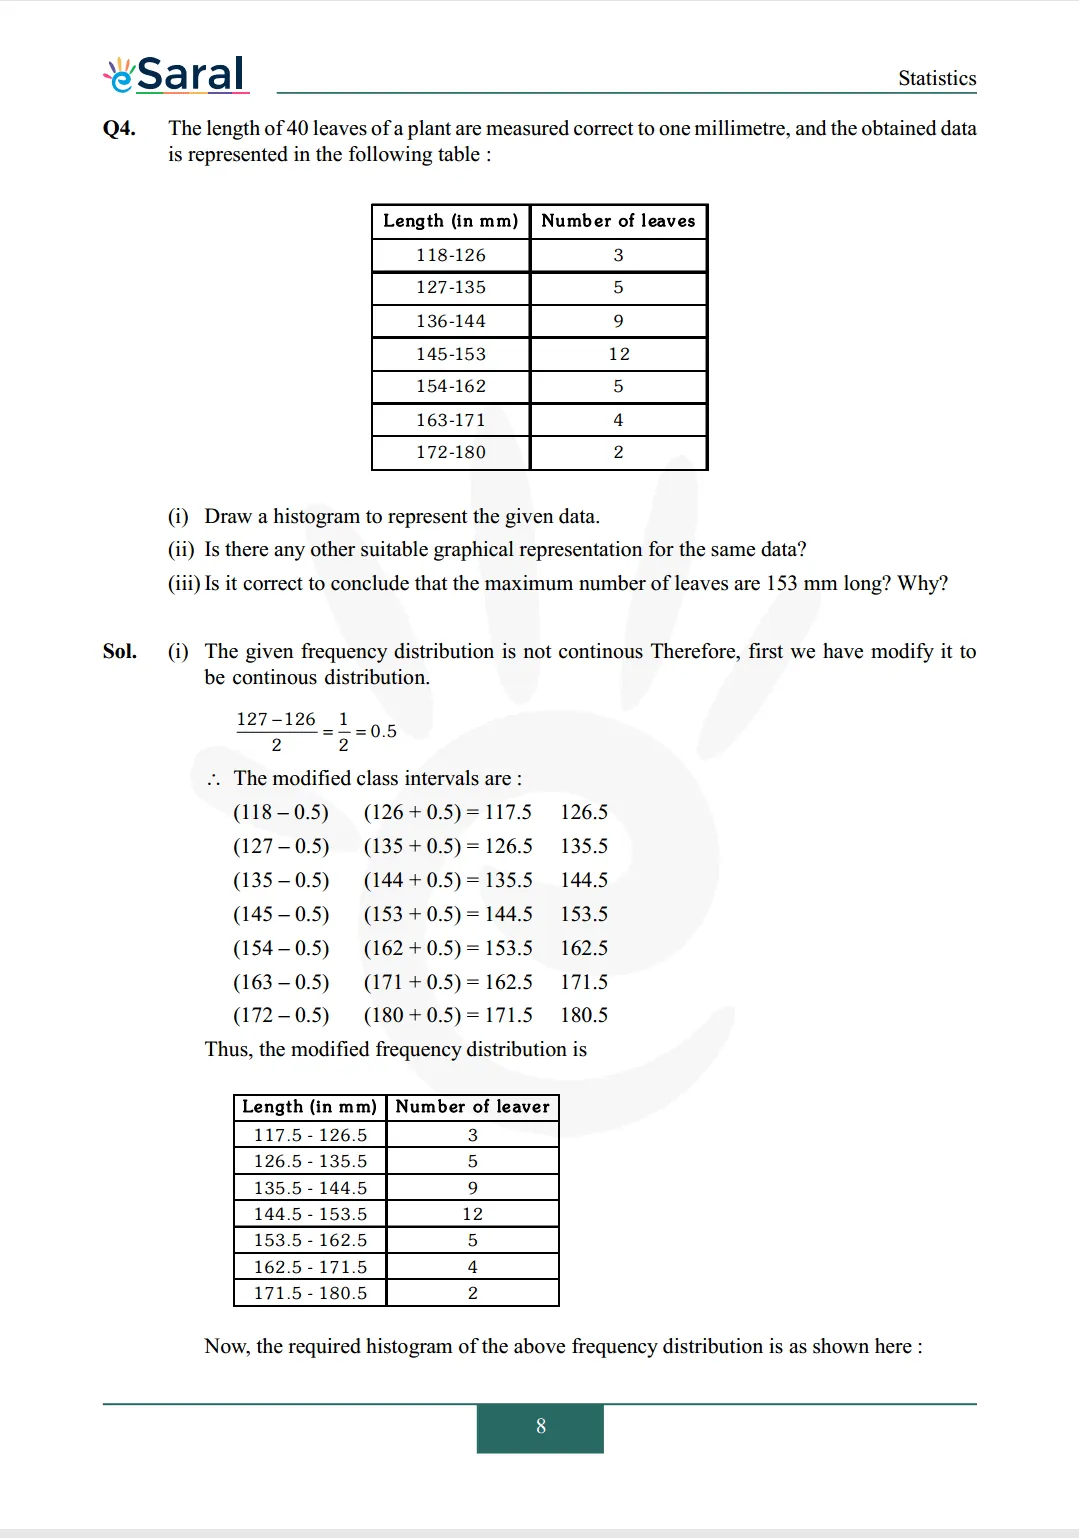
Q3. Given below are the seats won by different political parties in the polling outcome of a state assembly elections:
Political Party A B C D E F
Seats Won 75 55 37 29 10 37
(i) Draw a bar graph to represent the polling results.
(ii) Which political party won the maximum number of seats?
India's Best Exam Preparation for Class 9th - Download Now
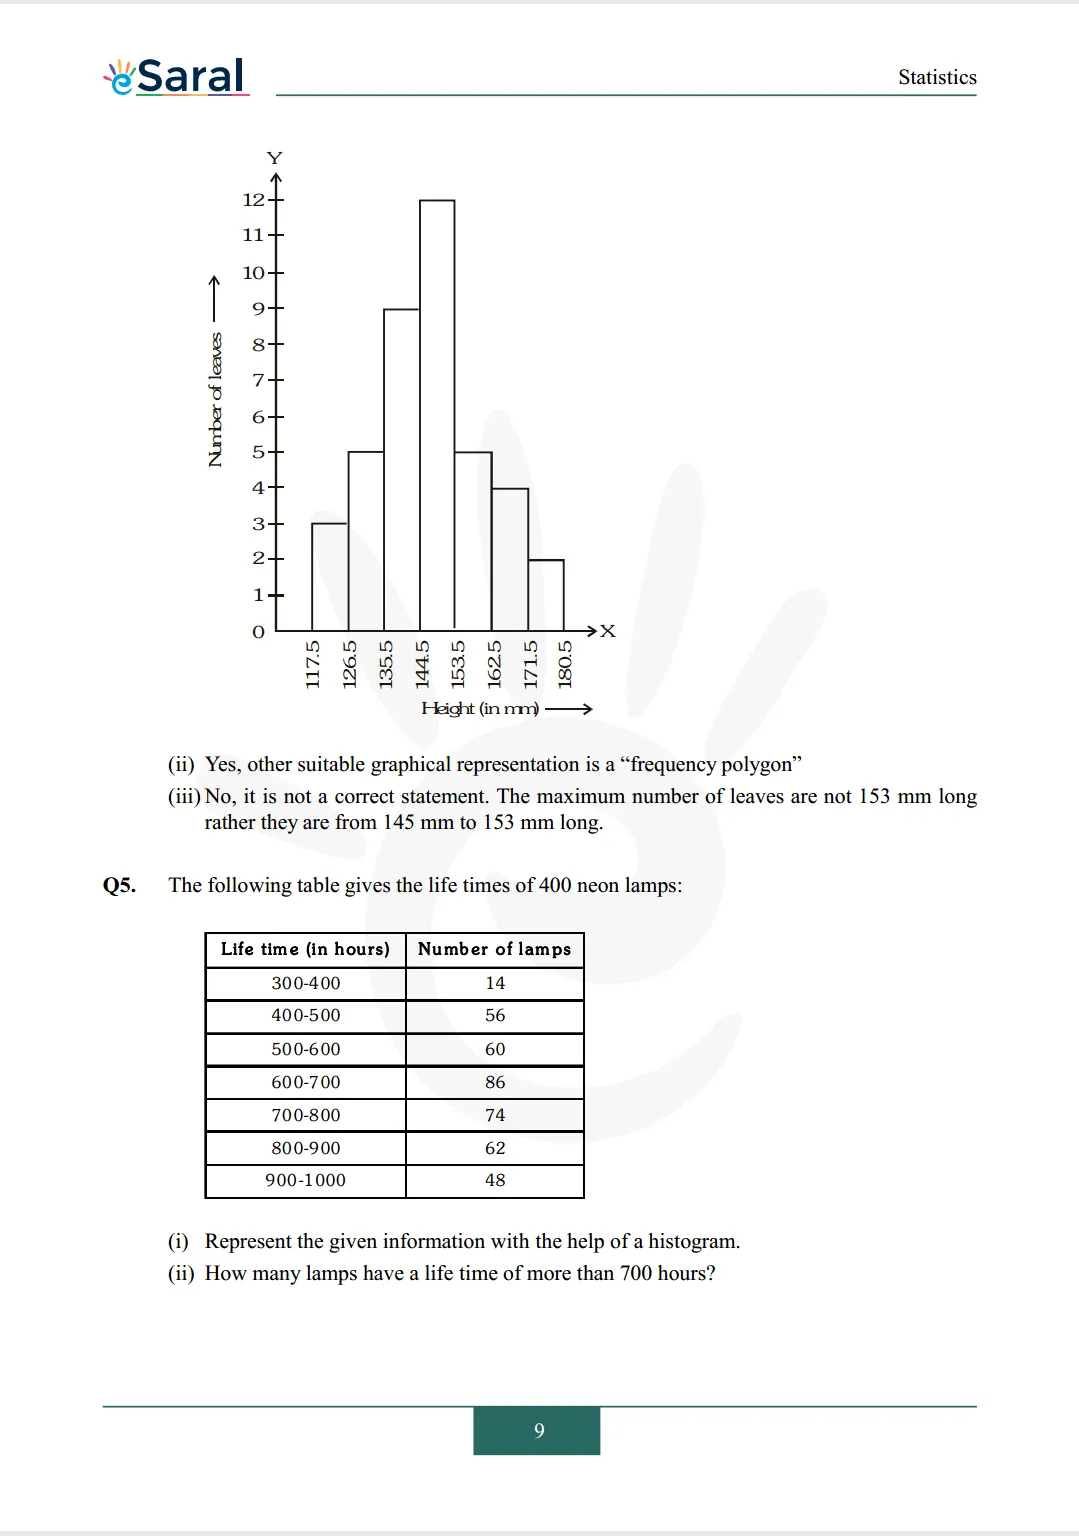
Q4. The length of 40 leaves of a plant are measured correct to one millimetre, and the obtained data is represented in the following table: 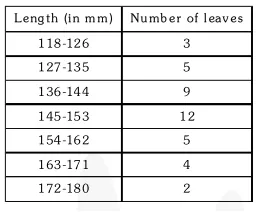
(i) Draw a histogram to represent the given data.
(ii) Is there any other suitable graphical representation for the same data?
(iii) Is it correct to conclude that the maximum number of leaves are 153 mm long? Why?
Q5. The following table gives the life times of 400 neon lamps: 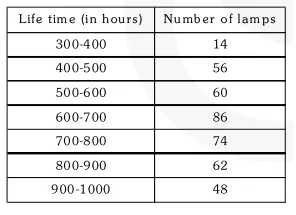
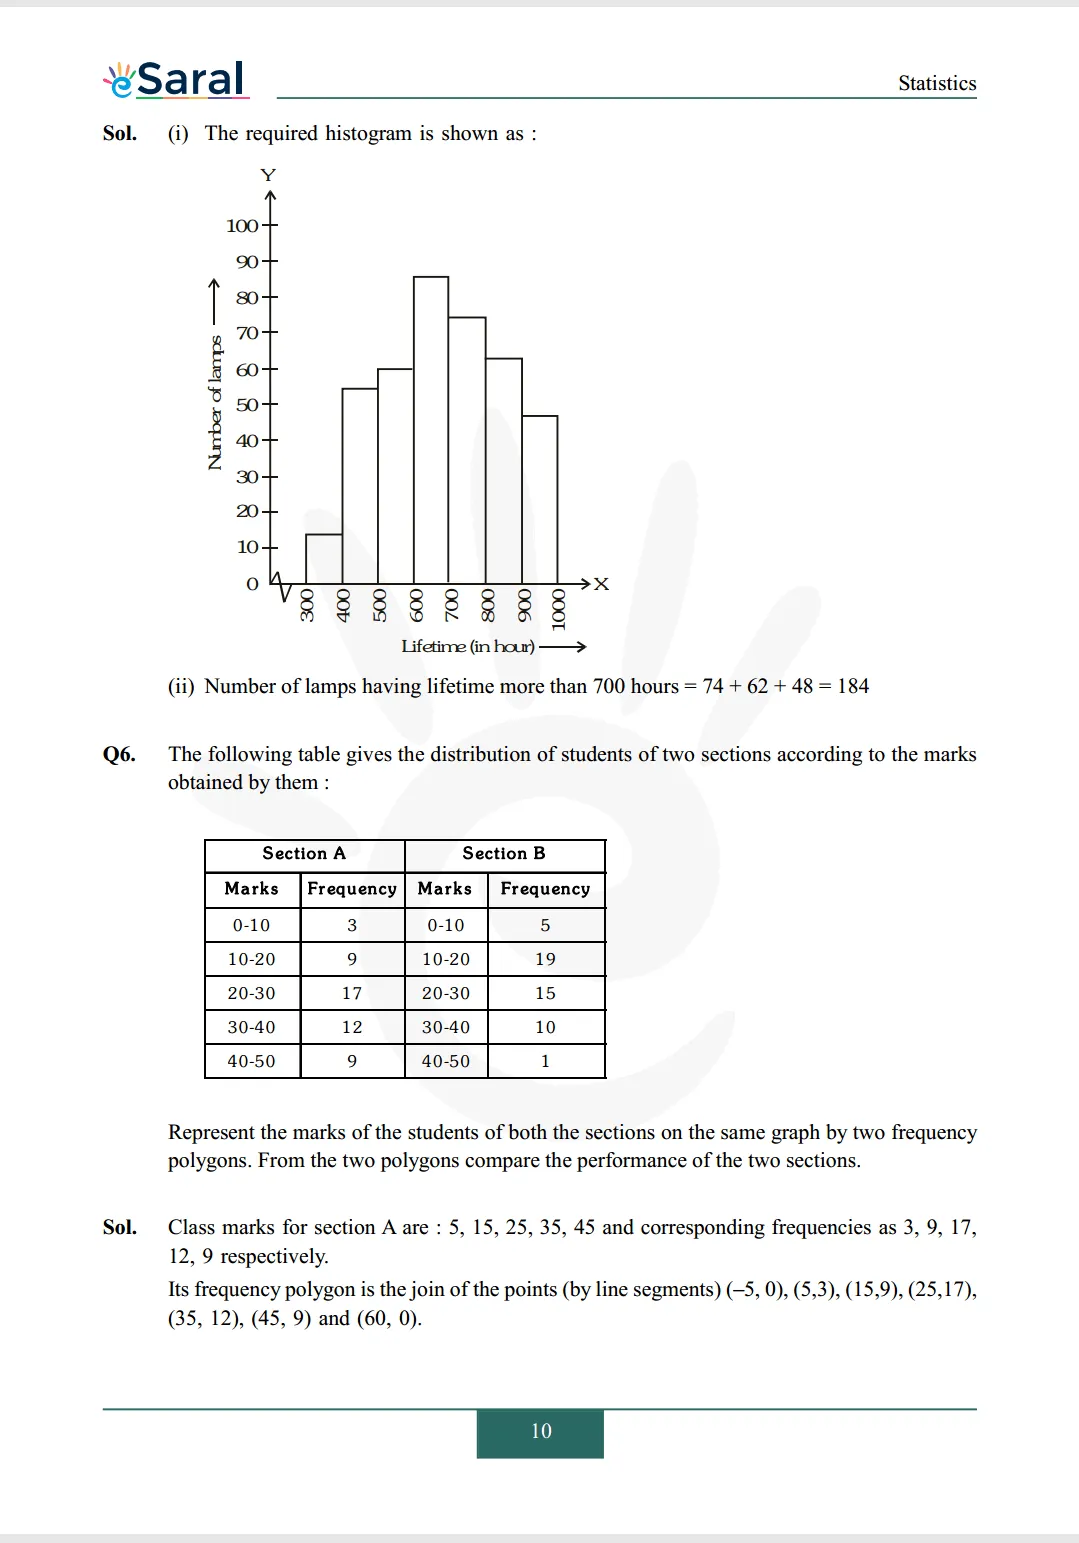
(i) Represent the given information with the help of a histogram.
(ii) How many lamps have a life time of more than 700 hours?
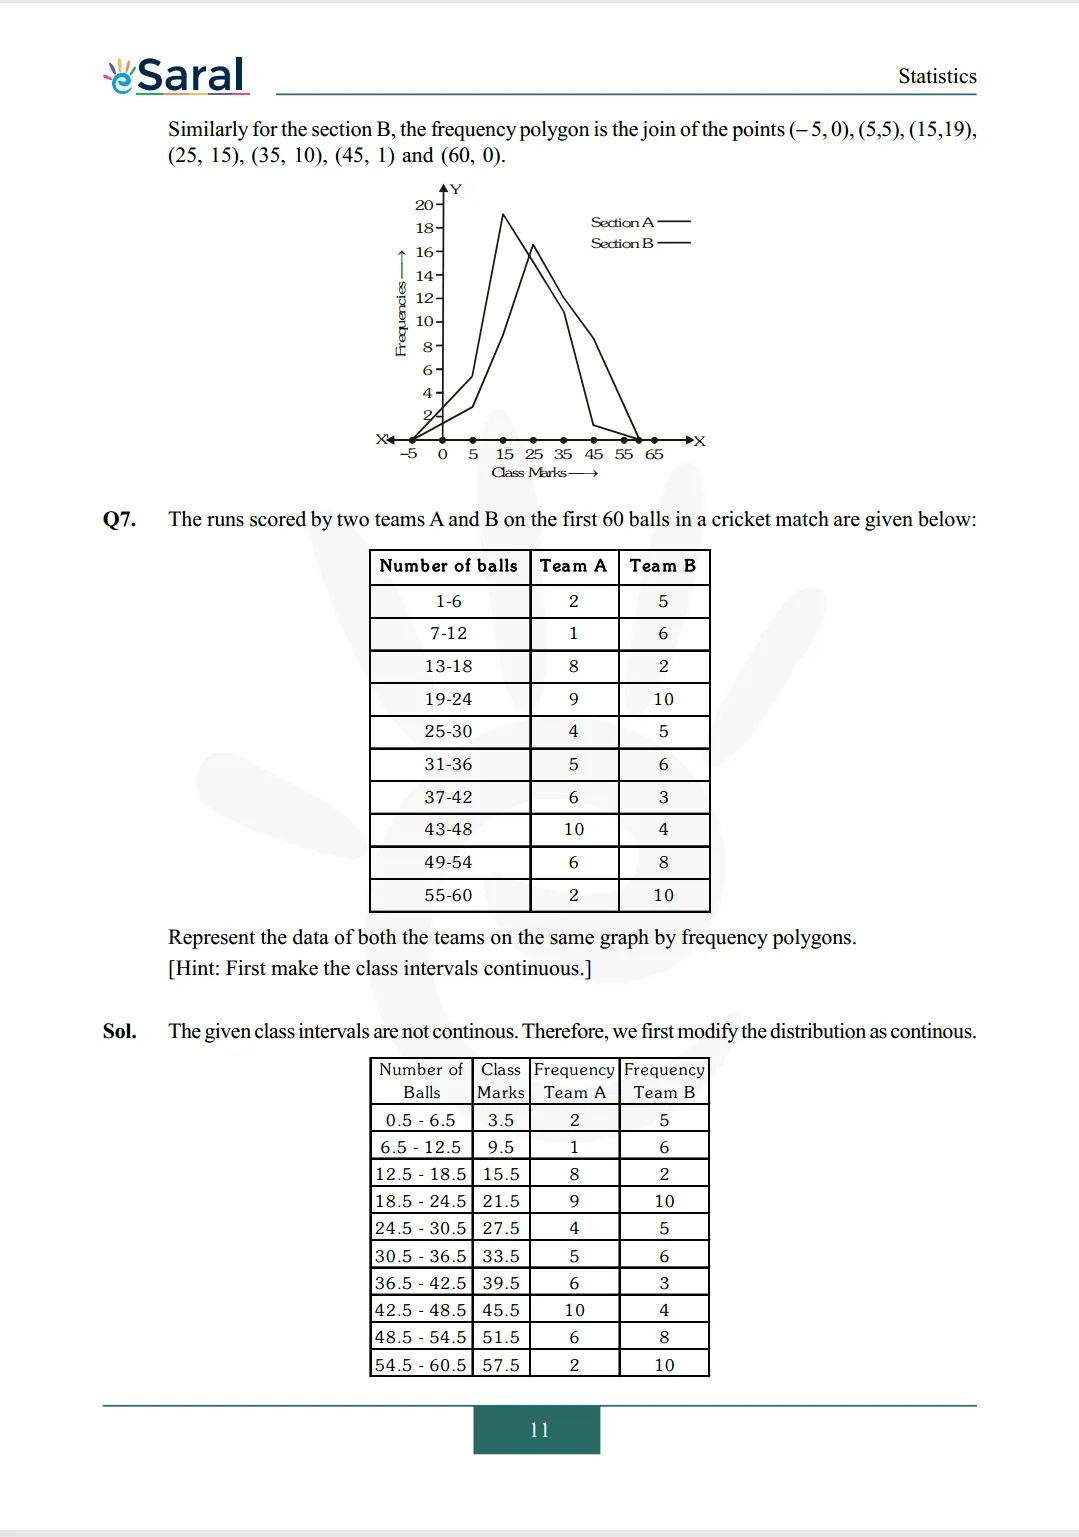
Q6. The following table gives the distribution of students of two sections according to the marks obtained by them: 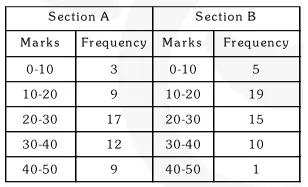
Represent the marks of the students of both the sections on the same graph by two frequency polygons. From the two polygons compare the performance of the two sections. Represent the marks of the students of both the sections on the same graph by two frequency polygons. From the two polygons compare the performance of the two sections.
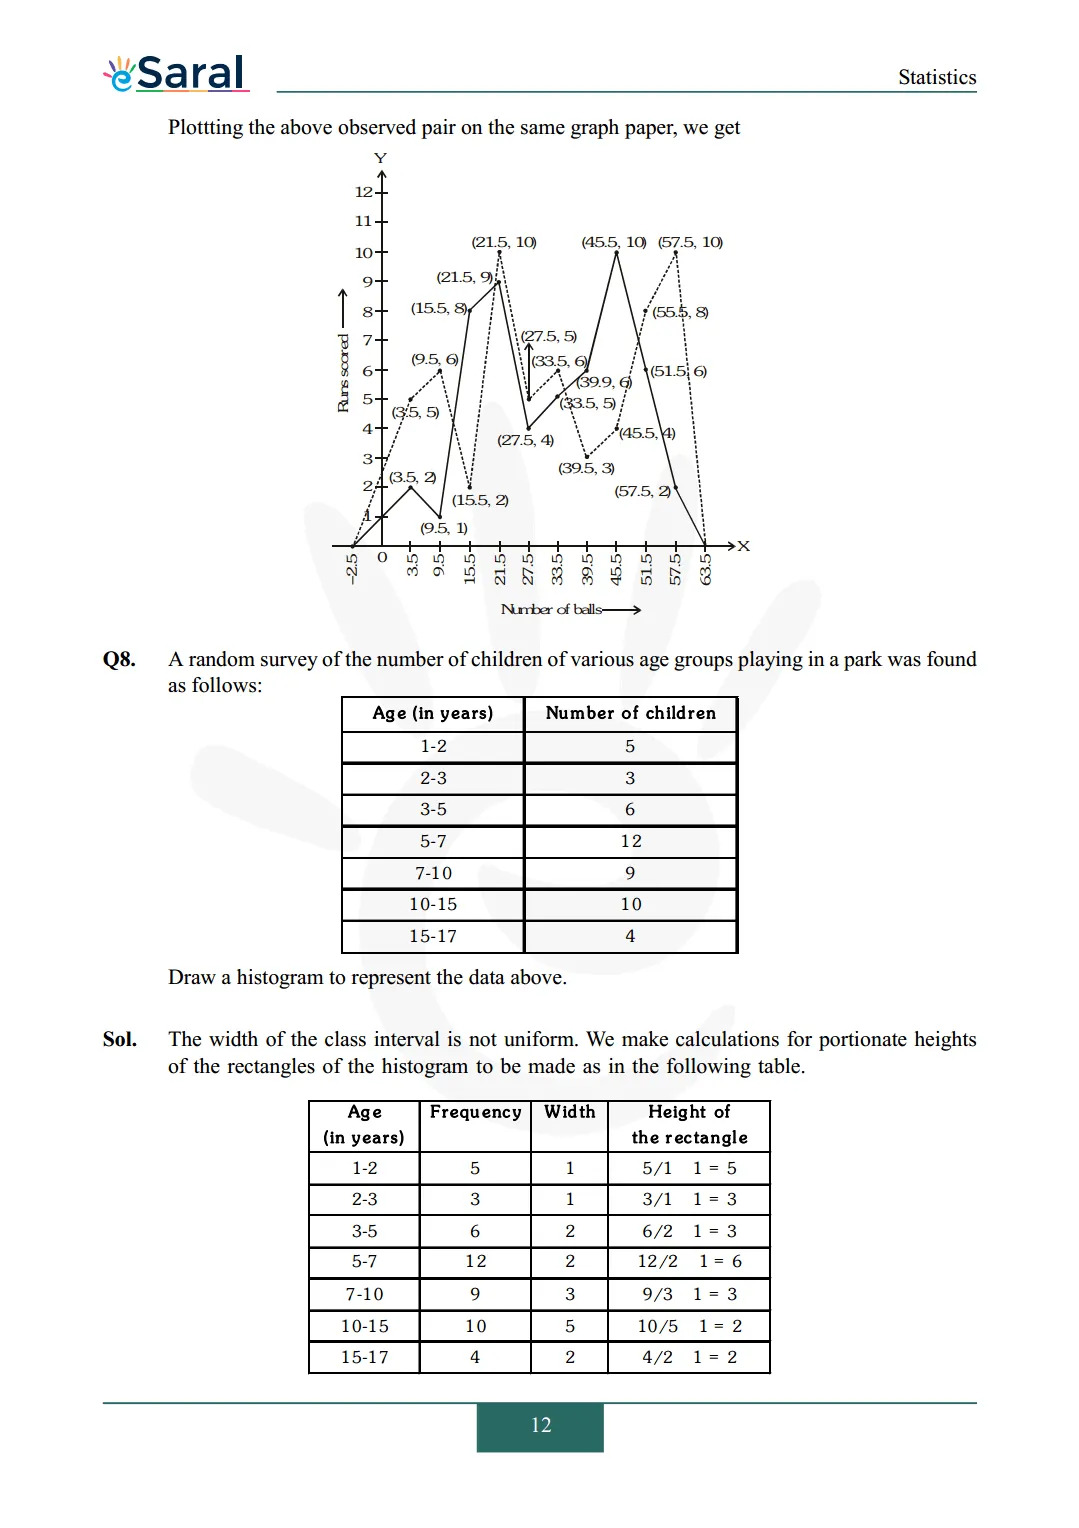
Q7. The runs scored by two teams $\mathrm{A}$ and $\mathrm{B}$ on the first 60 balls in a cricket match are given below: 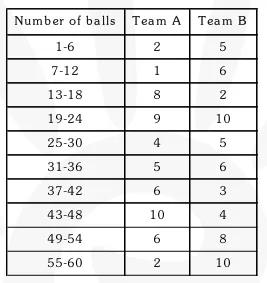
Represent the data of both the teams on the same graph by frequency polygons. [Hint: First make the class intervals continuous.]
Q8. A random survey of the number of children of various age groups playing in a park was found as follows: 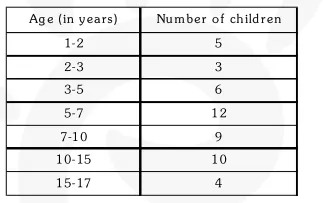
Draw a histogram to represent the data above.
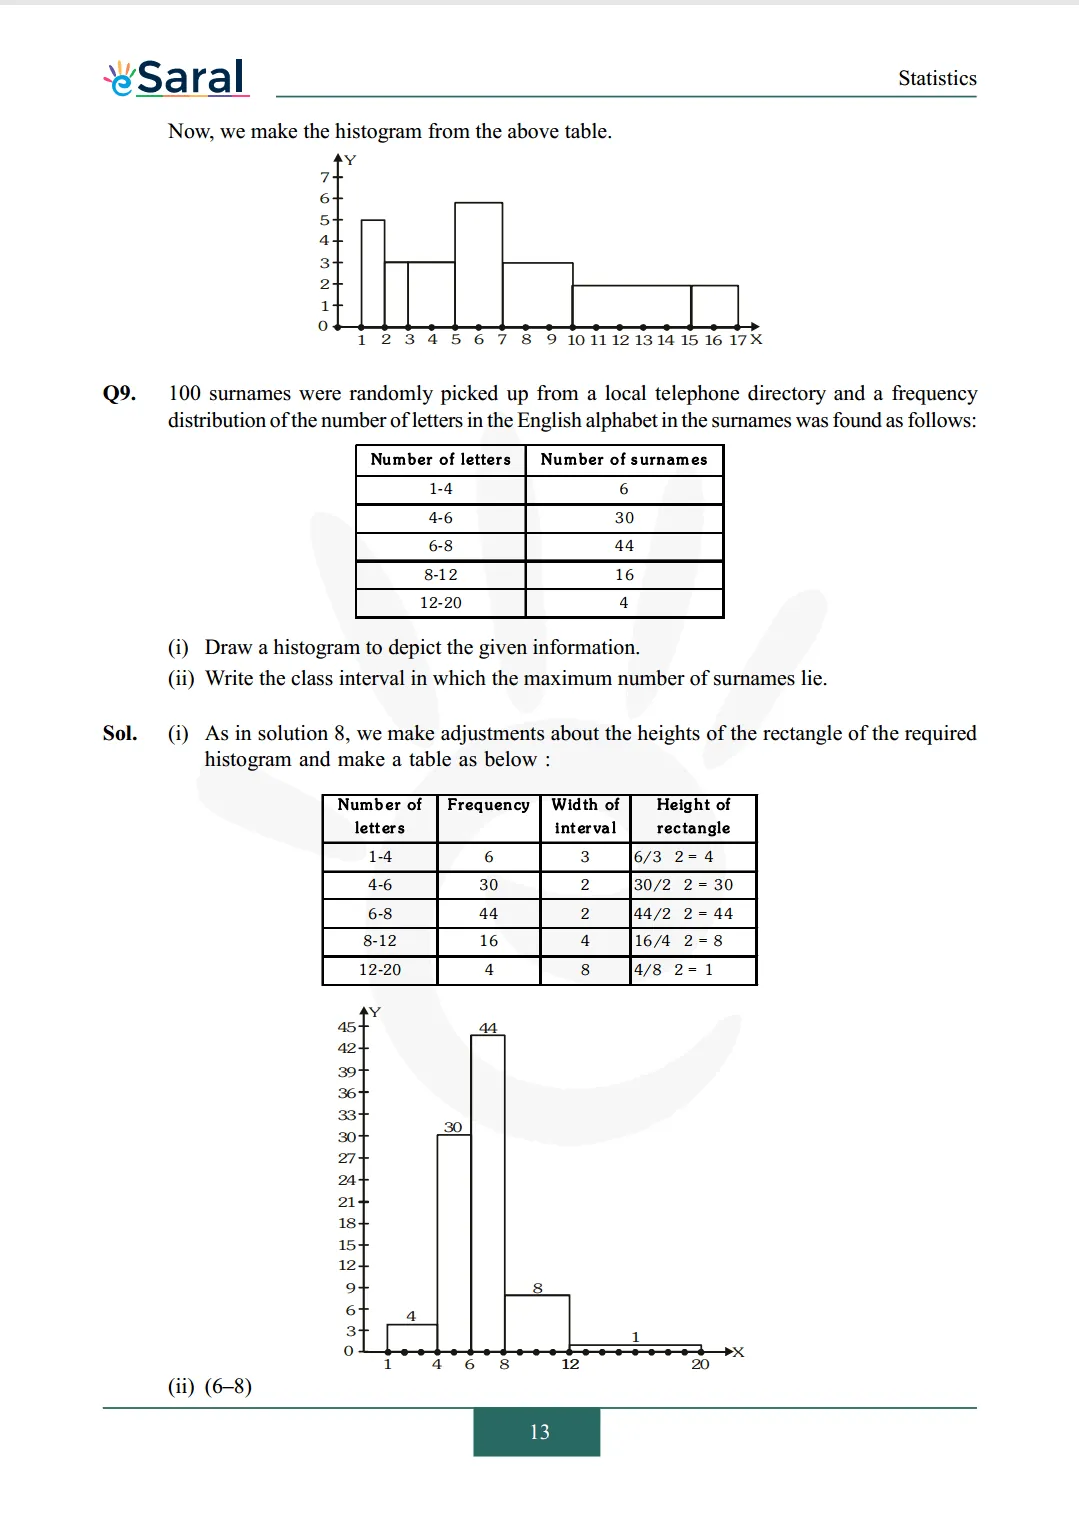
Q9. 100 surnames were randomly picked up from a local telephone directory and a frequency distribution of the number of letters in the English alphabet in the surnames was found as follows: 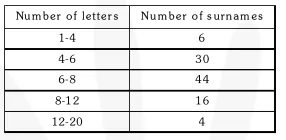
(i) Draw a histogram to depict the given information.
(ii) Write the class interval in which the maximum number of surnames lie.
Also Read,
India's Best Exam Preparation for Class 9th - Download Now
Download NCERT Class 9 Maths Book PDF
Download NCERT Class 9 Maths Exemplar PDF
Download Complete Solutions for Class 9 Maths chapter 14
Download Class 9 Maths Chapter 13 Exercise 13.1 Solutions
Download Class 9 Maths Chapter 13 Exercise 13.2 Solutions
Download Class 9 Maths Chapter 13 Exercise 13.3 Solutions
Download Class 9 Maths Chapter 13 Exercise 13.4 Solutions
If you have any Confusion related to NCERT Solutions for Class 9 Maths chapter 14 Exercise 14.3 then feel free to ask in the comments section down below.
To watch Free Learning Videos on Class 9 by Kota’s top Faculties Install the eSaral App