The following table gives the GDP in Rupees (Crores) by the three sectors:

Question.
The following table gives the GDP in Rupees (Crores) by the three sectors:
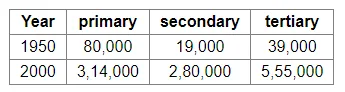
(i) Calculate the share of the three sectors in GDP for 1950 and 2000.
(ii) Show the data as a bar diagram similar to Graph 2 in the chapter.
(iii) What conclusions can we draw from the bar graph?
The following table gives the GDP in Rupees (Crores) by the three sectors:
(i) Calculate the share of the three sectors in GDP for 1950 and 2000.
(ii) Show the data as a bar diagram similar to Graph 2 in the chapter.
(iii) What conclusions can we draw from the bar graph?
Solution:
(i) In 1950,
primary sector = 57.97%, secondary sector = 13.77%, tertiary sector = 28.26%
In 2000,
primary sector = 27.33%, secondary sector = 24.37%, tertiary sector = 48.30%
(ii)
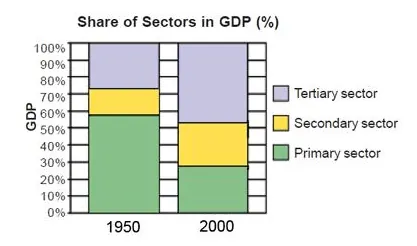
(iii) We can draw the conclusion that the share of the tertiary sector in the GDP has almost doubled, while that of the primary sector has almost halved. The secondary sector has grown by about 10% in the last five years.
(i) In 1950,
primary sector = 57.97%, secondary sector = 13.77%, tertiary sector = 28.26%
In 2000,
primary sector = 27.33%, secondary sector = 24.37%, tertiary sector = 48.30%
(ii)
(iii) We can draw the conclusion that the share of the tertiary sector in the GDP has almost doubled, while that of the primary sector has almost halved. The secondary sector has grown by about 10% in the last five years.