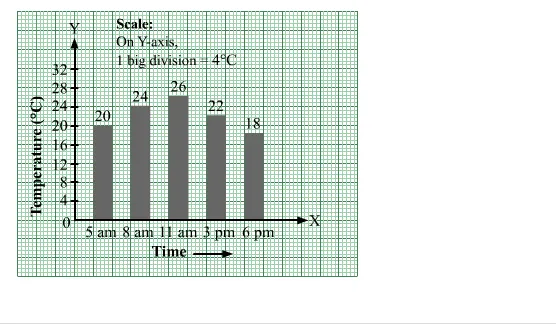
On a certain day, the temperature in a city was recorded as under:
Illustrate the data by a bar graph.
Share via...
Or copy link
Leave a comment
All Study Material